Israeli vs Latvian Cognitive Disability
COMPARE
Israeli
Latvian
Cognitive Disability
Cognitive Disability Comparison
Israelis
Latvians
17.0%
COGNITIVE DISABILITY
91.0/ 100
METRIC RATING
136th/ 347
METRIC RANK
16.6%
COGNITIVE DISABILITY
99.5/ 100
METRIC RATING
67th/ 347
METRIC RANK
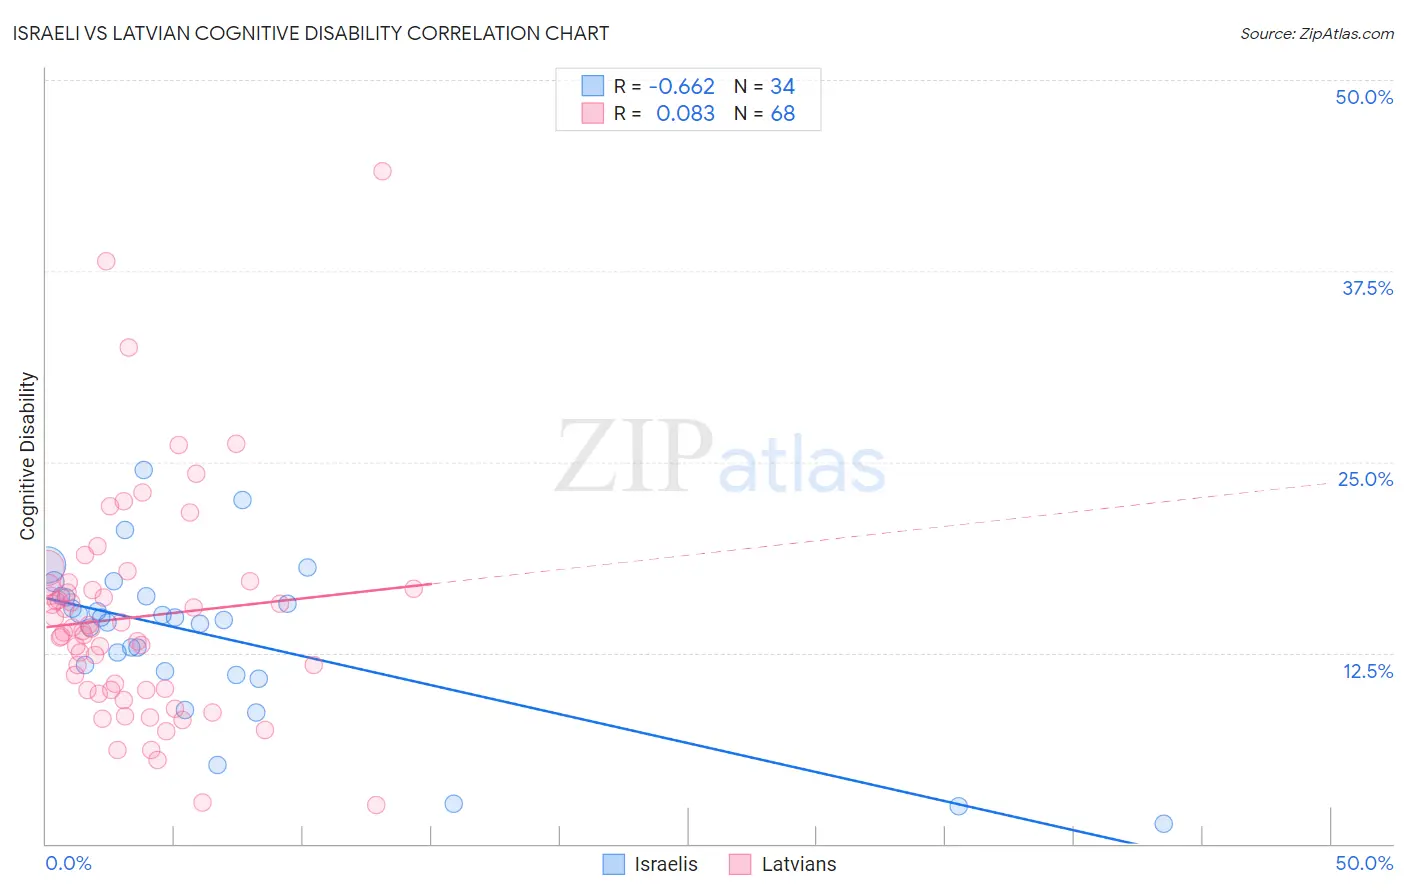
Israeli vs Latvian Cognitive Disability Correlation Chart
The statistical analysis conducted on geographies consisting of 211,174,000 people shows a significant negative correlation between the proportion of Israelis and percentage of population with cognitive disability in the United States with a correlation coefficient (R) of -0.662 and weighted average of 17.0%. Similarly, the statistical analysis conducted on geographies consisting of 220,719,023 people shows a slight positive correlation between the proportion of Latvians and percentage of population with cognitive disability in the United States with a correlation coefficient (R) of 0.083 and weighted average of 16.6%, a difference of 2.1%.
Cognitive Disability Correlation Summary
| Measurement | Israeli | Latvian |
| Minimum | 1.3% | 2.6% |
| Maximum | 24.5% | 44.0% |
| Range | 23.1% | 41.5% |
| Mean | 13.6% | 14.8% |
| Median | 14.7% | 14.0% |
| Interquartile 25% (IQ1) | 11.3% | 10.1% |
| Interquartile 75% (IQ3) | 16.2% | 16.8% |
| Interquartile Range (IQR) | 4.9% | 6.7% |
| Standard Deviation (Sample) | 5.2% | 7.2% |
| Standard Deviation (Population) | 5.1% | 7.2% |
Similar Demographics by Cognitive Disability
Demographics Similar to Israelis by Cognitive Disability
In terms of cognitive disability, the demographic groups most similar to Israelis are Immigrants from Norway (17.0%, a difference of 0.0%), Welsh (17.0%, a difference of 0.020%), Lebanese (17.0%, a difference of 0.030%), Immigrants from Chile (17.0%, a difference of 0.060%), and Immigrants from Jordan (17.0%, a difference of 0.080%).
| Demographics | Rating | Rank | Cognitive Disability |
| Immigrants | Uruguay | 92.9 /100 | #129 | Exceptional 17.0% |
| Immigrants | Vietnam | 92.4 /100 | #130 | Exceptional 17.0% |
| Immigrants | Germany | 92.1 /100 | #131 | Exceptional 17.0% |
| Whites/Caucasians | 92.1 /100 | #132 | Exceptional 17.0% |
| Immigrants | Jordan | 91.9 /100 | #133 | Exceptional 17.0% |
| Immigrants | Chile | 91.7 /100 | #134 | Exceptional 17.0% |
| Lebanese | 91.3 /100 | #135 | Exceptional 17.0% |
| Israelis | 91.0 /100 | #136 | Exceptional 17.0% |
| Immigrants | Norway | 90.9 /100 | #137 | Exceptional 17.0% |
| Welsh | 90.8 /100 | #138 | Exceptional 17.0% |
| French | 90.0 /100 | #139 | Excellent 17.0% |
| Chileans | 89.9 /100 | #140 | Excellent 17.0% |
| Aleuts | 89.9 /100 | #141 | Excellent 17.0% |
| Carpatho Rusyns | 89.6 /100 | #142 | Excellent 17.0% |
| British | 89.3 /100 | #143 | Excellent 17.0% |
Demographics Similar to Latvians by Cognitive Disability
In terms of cognitive disability, the demographic groups most similar to Latvians are Immigrants from Ukraine (16.6%, a difference of 0.040%), Ukrainian (16.6%, a difference of 0.040%), Immigrants from Uzbekistan (16.7%, a difference of 0.12%), Immigrants from Sweden (16.7%, a difference of 0.13%), and Immigrants from Belgium (16.7%, a difference of 0.14%).
| Demographics | Rating | Rank | Cognitive Disability |
| Romanians | 99.7 /100 | #60 | Exceptional 16.6% |
| Immigrants | England | 99.6 /100 | #61 | Exceptional 16.6% |
| Czechoslovakians | 99.6 /100 | #62 | Exceptional 16.6% |
| Argentineans | 99.6 /100 | #63 | Exceptional 16.6% |
| Venezuelans | 99.6 /100 | #64 | Exceptional 16.6% |
| Colombians | 99.6 /100 | #65 | Exceptional 16.6% |
| Immigrants | Ukraine | 99.5 /100 | #66 | Exceptional 16.6% |
| Latvians | 99.5 /100 | #67 | Exceptional 16.6% |
| Ukrainians | 99.4 /100 | #68 | Exceptional 16.6% |
| Immigrants | Uzbekistan | 99.4 /100 | #69 | Exceptional 16.7% |
| Immigrants | Sweden | 99.4 /100 | #70 | Exceptional 16.7% |
| Immigrants | Belgium | 99.3 /100 | #71 | Exceptional 16.7% |
| Germans | 99.3 /100 | #72 | Exceptional 16.7% |
| Burmese | 99.3 /100 | #73 | Exceptional 16.7% |
| Slavs | 99.3 /100 | #74 | Exceptional 16.7% |