Immigrants from Italy vs Latvian Cognitive Disability
COMPARE
Immigrants from Italy
Latvian
Cognitive Disability
Cognitive Disability Comparison
Immigrants from Italy
Latvians
16.5%
COGNITIVE DISABILITY
99.8/ 100
METRIC RATING
47th/ 347
METRIC RANK
16.6%
COGNITIVE DISABILITY
99.5/ 100
METRIC RATING
67th/ 347
METRIC RANK
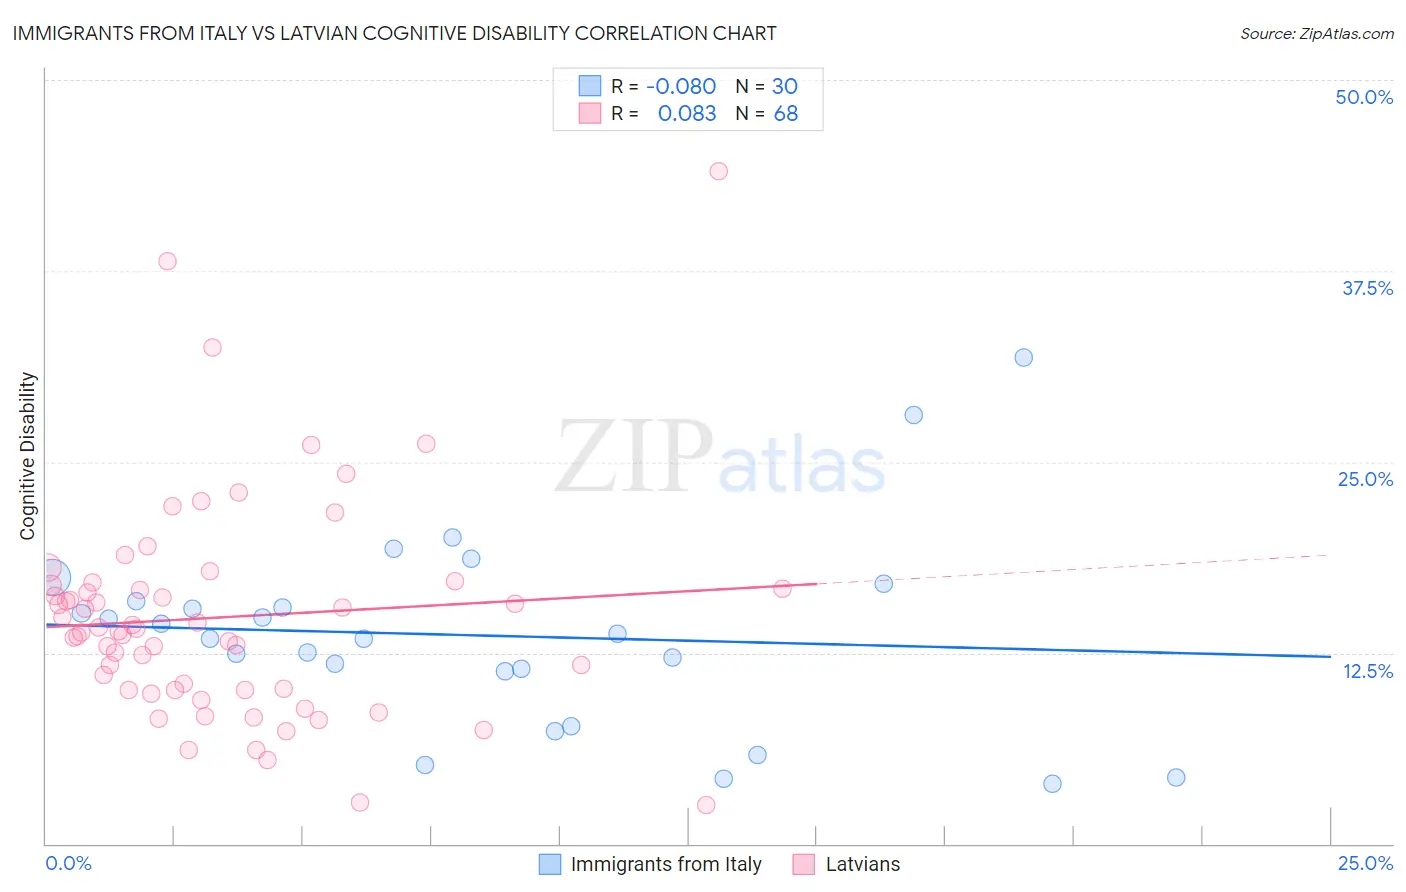
Immigrants from Italy vs Latvian Cognitive Disability Correlation Chart
The statistical analysis conducted on geographies consisting of 324,202,765 people shows a slight negative correlation between the proportion of Immigrants from Italy and percentage of population with cognitive disability in the United States with a correlation coefficient (R) of -0.080 and weighted average of 16.5%. Similarly, the statistical analysis conducted on geographies consisting of 220,719,023 people shows a slight positive correlation between the proportion of Latvians and percentage of population with cognitive disability in the United States with a correlation coefficient (R) of 0.083 and weighted average of 16.6%, a difference of 0.87%.
Cognitive Disability Correlation Summary
| Measurement | Immigrants from Italy | Latvian |
| Minimum | 3.9% | 2.6% |
| Maximum | 31.9% | 44.0% |
| Range | 27.9% | 41.5% |
| Mean | 13.6% | 14.8% |
| Median | 13.6% | 14.0% |
| Interquartile 25% (IQ1) | 11.3% | 10.1% |
| Interquartile 75% (IQ3) | 15.9% | 16.8% |
| Interquartile Range (IQR) | 4.6% | 6.7% |
| Standard Deviation (Sample) | 6.4% | 7.2% |
| Standard Deviation (Population) | 6.3% | 7.2% |
Demographics Similar to Immigrants from Italy and Latvians by Cognitive Disability
In terms of cognitive disability, the demographic groups most similar to Immigrants from Italy are Immigrants from North America (16.5%, a difference of 0.0%), Iranian (16.5%, a difference of 0.040%), Norwegian (16.5%, a difference of 0.050%), Immigrants from Korea (16.5%, a difference of 0.090%), and Soviet Union (16.5%, a difference of 0.13%). Similarly, the demographic groups most similar to Latvians are Immigrants from Ukraine (16.6%, a difference of 0.040%), Colombian (16.6%, a difference of 0.16%), Venezuelan (16.6%, a difference of 0.18%), Argentinean (16.6%, a difference of 0.24%), and Czechoslovakian (16.6%, a difference of 0.26%).
| Demographics | Rating | Rank | Cognitive Disability |
| Immigrants | Italy | 99.8 /100 | #47 | Exceptional 16.5% |
| Immigrants | North America | 99.8 /100 | #48 | Exceptional 16.5% |
| Iranians | 99.8 /100 | #49 | Exceptional 16.5% |
| Norwegians | 99.8 /100 | #50 | Exceptional 16.5% |
| Immigrants | Korea | 99.8 /100 | #51 | Exceptional 16.5% |
| Soviet Union | 99.8 /100 | #52 | Exceptional 16.5% |
| Swedes | 99.8 /100 | #53 | Exceptional 16.5% |
| Immigrants | Iran | 99.8 /100 | #54 | Exceptional 16.5% |
| Immigrants | Venezuela | 99.7 /100 | #55 | Exceptional 16.5% |
| Austrians | 99.7 /100 | #56 | Exceptional 16.6% |
| Bhutanese | 99.7 /100 | #57 | Exceptional 16.6% |
| Pennsylvania Germans | 99.7 /100 | #58 | Exceptional 16.6% |
| Immigrants | Peru | 99.7 /100 | #59 | Exceptional 16.6% |
| Romanians | 99.7 /100 | #60 | Exceptional 16.6% |
| Immigrants | England | 99.6 /100 | #61 | Exceptional 16.6% |
| Czechoslovakians | 99.6 /100 | #62 | Exceptional 16.6% |
| Argentineans | 99.6 /100 | #63 | Exceptional 16.6% |
| Venezuelans | 99.6 /100 | #64 | Exceptional 16.6% |
| Colombians | 99.6 /100 | #65 | Exceptional 16.6% |
| Immigrants | Ukraine | 99.5 /100 | #66 | Exceptional 16.6% |
| Latvians | 99.5 /100 | #67 | Exceptional 16.6% |