Immigrants from Hungary vs Latvian Cognitive Disability
COMPARE
Immigrants from Hungary
Latvian
Cognitive Disability
Cognitive Disability Comparison
Immigrants from Hungary
Latvians
16.7%
COGNITIVE DISABILITY
99.3/ 100
METRIC RATING
77th/ 347
METRIC RANK
16.6%
COGNITIVE DISABILITY
99.5/ 100
METRIC RATING
67th/ 347
METRIC RANK
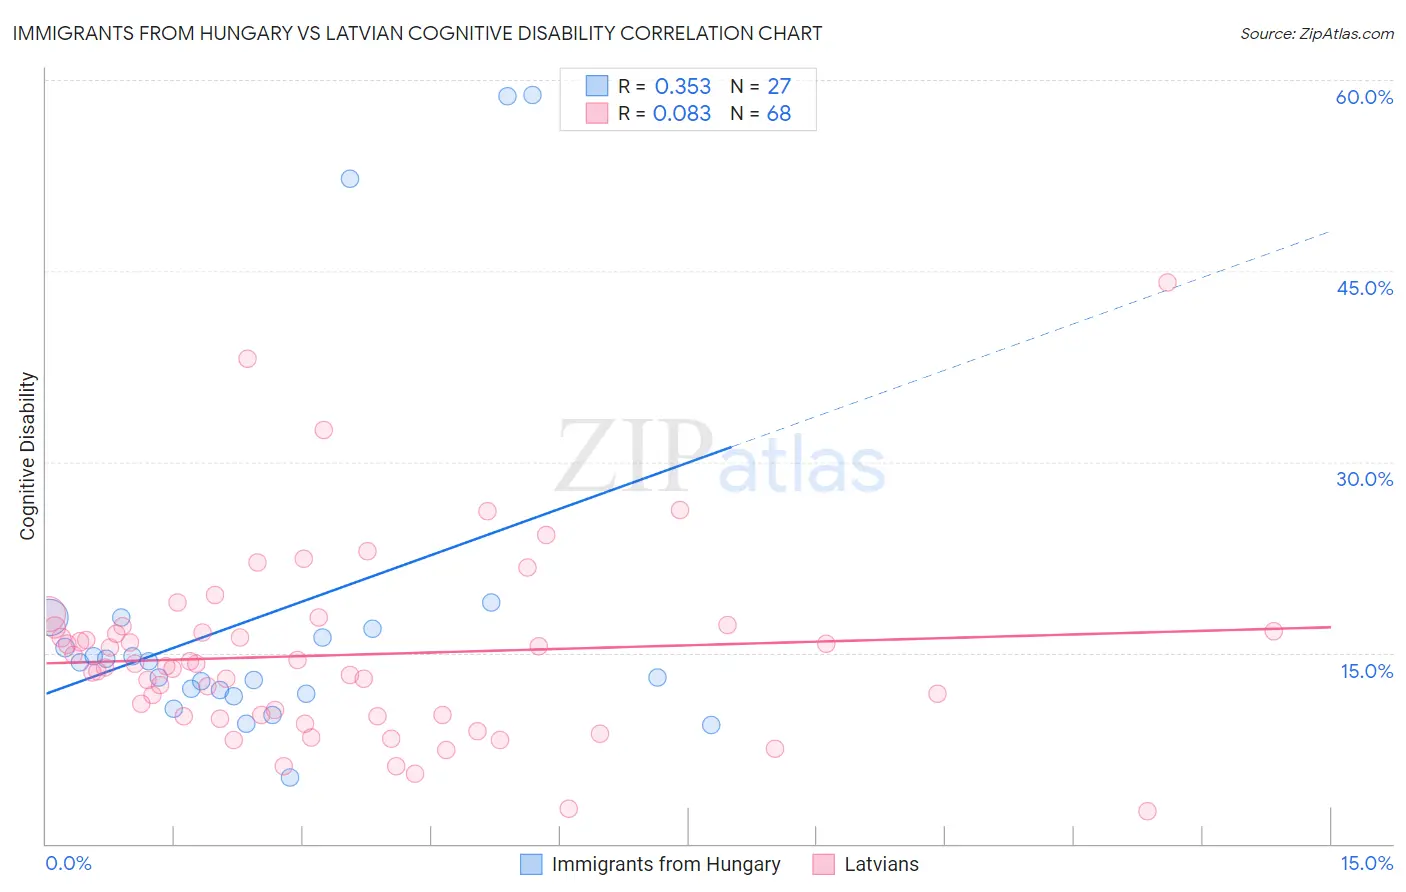
Immigrants from Hungary vs Latvian Cognitive Disability Correlation Chart
The statistical analysis conducted on geographies consisting of 195,708,198 people shows a mild positive correlation between the proportion of Immigrants from Hungary and percentage of population with cognitive disability in the United States with a correlation coefficient (R) of 0.353 and weighted average of 16.7%. Similarly, the statistical analysis conducted on geographies consisting of 220,719,023 people shows a slight positive correlation between the proportion of Latvians and percentage of population with cognitive disability in the United States with a correlation coefficient (R) of 0.083 and weighted average of 16.6%, a difference of 0.20%.
Cognitive Disability Correlation Summary
| Measurement | Immigrants from Hungary | Latvian |
| Minimum | 5.2% | 2.6% |
| Maximum | 58.8% | 44.0% |
| Range | 53.6% | 41.5% |
| Mean | 18.1% | 14.8% |
| Median | 14.2% | 14.0% |
| Interquartile 25% (IQ1) | 11.8% | 10.1% |
| Interquartile 75% (IQ3) | 16.8% | 16.8% |
| Interquartile Range (IQR) | 5.0% | 6.7% |
| Standard Deviation (Sample) | 14.2% | 7.2% |
| Standard Deviation (Population) | 13.9% | 7.2% |
Demographics Similar to Immigrants from Hungary and Latvians by Cognitive Disability
In terms of cognitive disability, the demographic groups most similar to Immigrants from Hungary are Peruvian (16.7%, a difference of 0.0%), Immigrants from Serbia (16.7%, a difference of 0.010%), Immigrants from Bulgaria (16.7%, a difference of 0.010%), Estonian (16.7%, a difference of 0.030%), and Burmese (16.7%, a difference of 0.040%). Similarly, the demographic groups most similar to Latvians are Immigrants from Ukraine (16.6%, a difference of 0.040%), Ukrainian (16.6%, a difference of 0.040%), Immigrants from Uzbekistan (16.7%, a difference of 0.12%), Immigrants from Sweden (16.7%, a difference of 0.13%), and Immigrants from Belgium (16.7%, a difference of 0.14%).
| Demographics | Rating | Rank | Cognitive Disability |
| Czechoslovakians | 99.6 /100 | #62 | Exceptional 16.6% |
| Argentineans | 99.6 /100 | #63 | Exceptional 16.6% |
| Venezuelans | 99.6 /100 | #64 | Exceptional 16.6% |
| Colombians | 99.6 /100 | #65 | Exceptional 16.6% |
| Immigrants | Ukraine | 99.5 /100 | #66 | Exceptional 16.6% |
| Latvians | 99.5 /100 | #67 | Exceptional 16.6% |
| Ukrainians | 99.4 /100 | #68 | Exceptional 16.6% |
| Immigrants | Uzbekistan | 99.4 /100 | #69 | Exceptional 16.7% |
| Immigrants | Sweden | 99.4 /100 | #70 | Exceptional 16.7% |
| Immigrants | Belgium | 99.3 /100 | #71 | Exceptional 16.7% |
| Germans | 99.3 /100 | #72 | Exceptional 16.7% |
| Burmese | 99.3 /100 | #73 | Exceptional 16.7% |
| Slavs | 99.3 /100 | #74 | Exceptional 16.7% |
| Estonians | 99.3 /100 | #75 | Exceptional 16.7% |
| Immigrants | Serbia | 99.3 /100 | #76 | Exceptional 16.7% |
| Immigrants | Hungary | 99.3 /100 | #77 | Exceptional 16.7% |
| Peruvians | 99.3 /100 | #78 | Exceptional 16.7% |
| Immigrants | Bulgaria | 99.3 /100 | #79 | Exceptional 16.7% |
| Egyptians | 99.2 /100 | #80 | Exceptional 16.7% |
| Immigrants | Netherlands | 99.2 /100 | #81 | Exceptional 16.7% |
| Swiss | 99.2 /100 | #82 | Exceptional 16.7% |