Finnish vs Immigrants from Costa Rica Disability
COMPARE
Finnish
Immigrants from Costa Rica
Disability
Disability Comparison
Finns
Immigrants from Costa Rica
12.7%
DISABILITY
0.0/ 100
METRIC RATING
273rd/ 347
METRIC RANK
11.4%
DISABILITY
93.4/ 100
METRIC RATING
121st/ 347
METRIC RANK
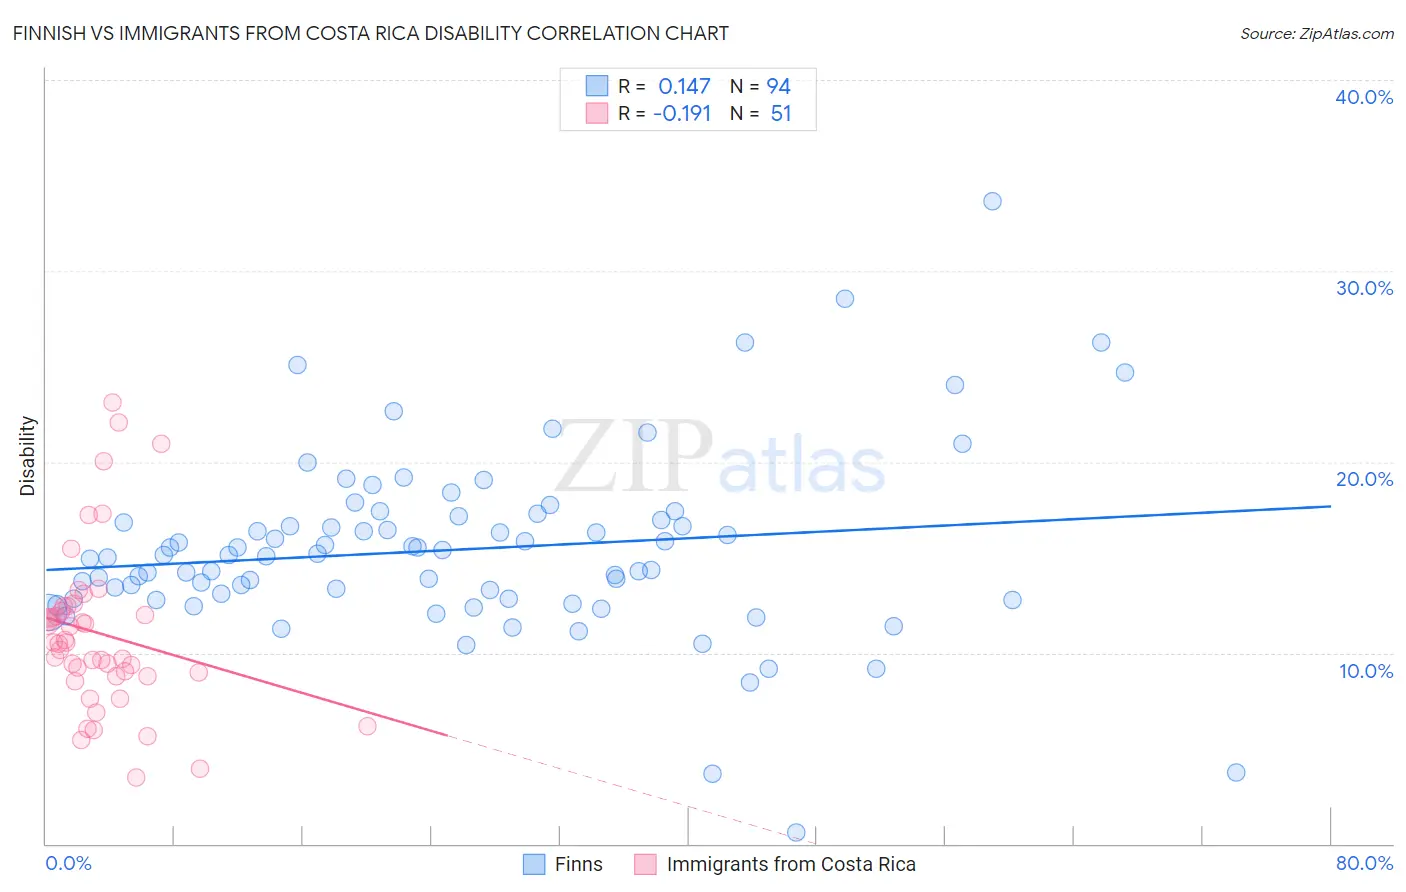
Finnish vs Immigrants from Costa Rica Disability Correlation Chart
The statistical analysis conducted on geographies consisting of 404,645,748 people shows a poor positive correlation between the proportion of Finns and percentage of population with a disability in the United States with a correlation coefficient (R) of 0.147 and weighted average of 12.7%. Similarly, the statistical analysis conducted on geographies consisting of 204,275,653 people shows a poor negative correlation between the proportion of Immigrants from Costa Rica and percentage of population with a disability in the United States with a correlation coefficient (R) of -0.191 and weighted average of 11.4%, a difference of 11.9%.
Disability Correlation Summary
| Measurement | Finnish | Immigrants from Costa Rica |
| Minimum | 0.58% | 3.5% |
| Maximum | 33.6% | 23.1% |
| Range | 33.1% | 19.6% |
| Mean | 15.4% | 11.0% |
| Median | 15.1% | 10.5% |
| Interquartile 25% (IQ1) | 12.8% | 8.8% |
| Interquartile 75% (IQ3) | 17.0% | 12.4% |
| Interquartile Range (IQR) | 4.2% | 3.6% |
| Standard Deviation (Sample) | 4.8% | 4.2% |
| Standard Deviation (Population) | 4.8% | 4.2% |
Similar Demographics by Disability
Demographics Similar to Finns by Disability
In terms of disability, the demographic groups most similar to Finns are Dominican (12.7%, a difference of 0.16%), Nepalese (12.8%, a difference of 0.43%), Sioux (12.8%, a difference of 0.51%), Immigrants from Yemen (12.6%, a difference of 0.66%), and Hmong (12.8%, a difference of 0.67%).
| Demographics | Rating | Rank | Disability |
| Czechoslovakians | 0.2 /100 | #266 | Tragic 12.5% |
| Spaniards | 0.2 /100 | #267 | Tragic 12.5% |
| Bangladeshis | 0.1 /100 | #268 | Tragic 12.6% |
| Immigrants | Dominican Republic | 0.1 /100 | #269 | Tragic 12.6% |
| Portuguese | 0.1 /100 | #270 | Tragic 12.6% |
| Immigrants | Yemen | 0.1 /100 | #271 | Tragic 12.6% |
| Dominicans | 0.0 /100 | #272 | Tragic 12.7% |
| Finns | 0.0 /100 | #273 | Tragic 12.7% |
| Nepalese | 0.0 /100 | #274 | Tragic 12.8% |
| Sioux | 0.0 /100 | #275 | Tragic 12.8% |
| Hmong | 0.0 /100 | #276 | Tragic 12.8% |
| Dutch | 0.0 /100 | #277 | Tragic 12.8% |
| Germans | 0.0 /100 | #278 | Tragic 12.8% |
| Fijians | 0.0 /100 | #279 | Tragic 12.8% |
| Spanish | 0.0 /100 | #280 | Tragic 12.8% |
Demographics Similar to Immigrants from Costa Rica by Disability
In terms of disability, the demographic groups most similar to Immigrants from Costa Rica are Central American (11.4%, a difference of 0.010%), Immigrants from North Macedonia (11.4%, a difference of 0.010%), Brazilian (11.4%, a difference of 0.020%), Korean (11.3%, a difference of 0.070%), and Luxembourger (11.3%, a difference of 0.080%).
| Demographics | Rating | Rank | Disability |
| Immigrants | Syria | 94.7 /100 | #114 | Exceptional 11.3% |
| Immigrants | Philippines | 94.6 /100 | #115 | Exceptional 11.3% |
| Immigrants | Northern Europe | 94.1 /100 | #116 | Exceptional 11.3% |
| Luxembourgers | 93.9 /100 | #117 | Exceptional 11.3% |
| Koreans | 93.8 /100 | #118 | Exceptional 11.3% |
| Central Americans | 93.5 /100 | #119 | Exceptional 11.4% |
| Immigrants | North Macedonia | 93.5 /100 | #120 | Exceptional 11.4% |
| Immigrants | Costa Rica | 93.4 /100 | #121 | Exceptional 11.4% |
| Brazilians | 93.3 /100 | #122 | Exceptional 11.4% |
| South Africans | 92.3 /100 | #123 | Exceptional 11.4% |
| South American Indians | 92.2 /100 | #124 | Exceptional 11.4% |
| Costa Ricans | 91.9 /100 | #125 | Exceptional 11.4% |
| Immigrants | Latvia | 90.9 /100 | #126 | Exceptional 11.4% |
| Immigrants | Italy | 90.4 /100 | #127 | Exceptional 11.4% |
| Immigrants | Europe | 90.4 /100 | #128 | Exceptional 11.4% |