Immigrants from Australia vs Immigrants from South Central Asia Disability Age Under 5
COMPARE
Immigrants from Australia
Immigrants from South Central Asia
Disability Age Under 5
Disability Age Under 5 Comparison
Immigrants from Australia
Immigrants from South Central Asia
1.2%
DISABILITY AGE UNDER 5
94.4/ 100
METRIC RATING
112th/ 347
METRIC RANK
1.0%
DISABILITY AGE UNDER 5
99.9/ 100
METRIC RATING
30th/ 347
METRIC RANK
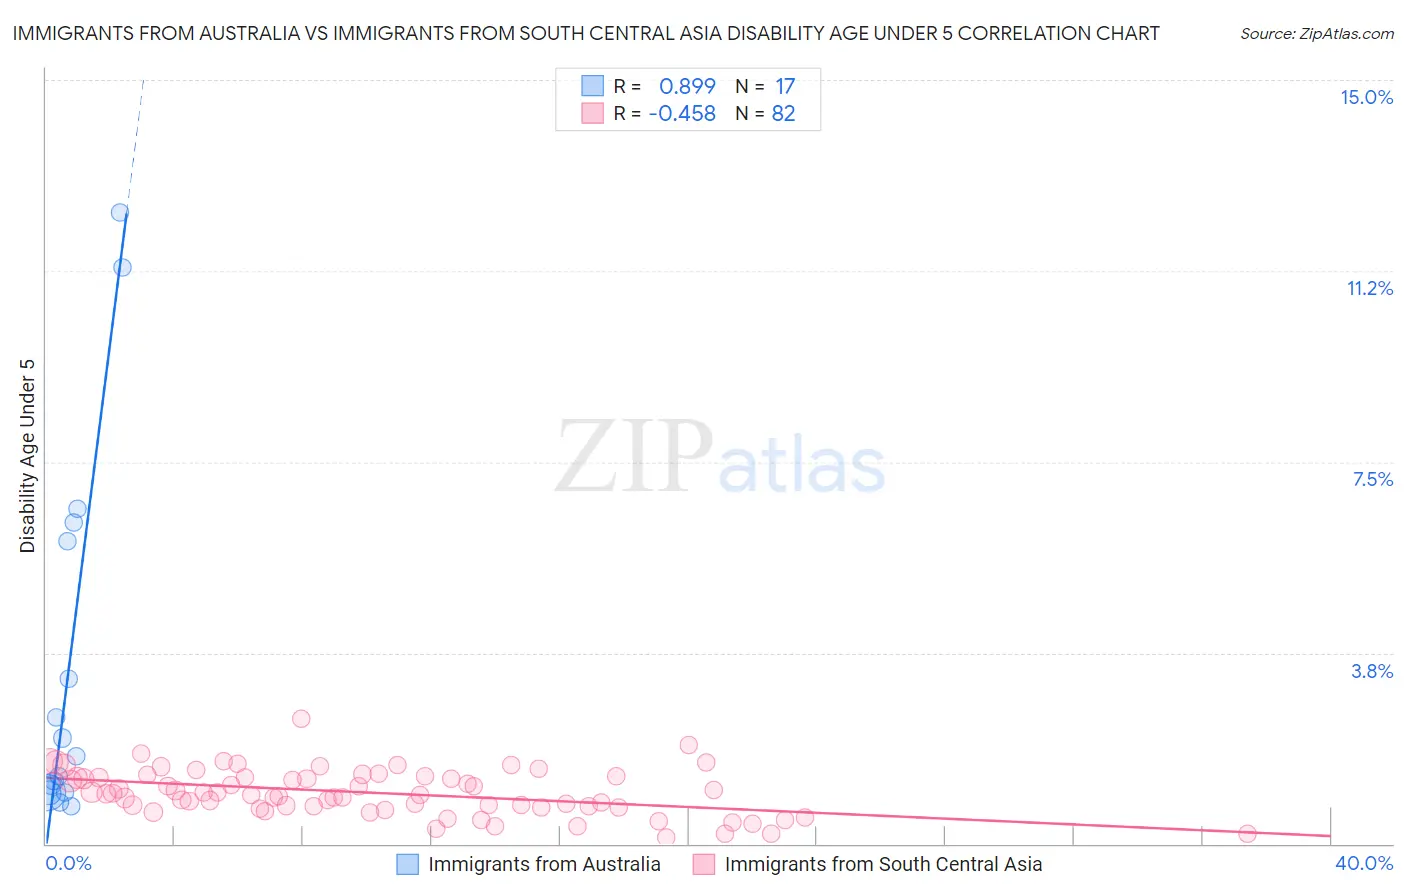
Immigrants from Australia vs Immigrants from South Central Asia Disability Age Under 5 Correlation Chart
The statistical analysis conducted on geographies consisting of 143,101,836 people shows a very strong positive correlation between the proportion of Immigrants from Australia and percentage of population with a disability under the age of 5 in the United States with a correlation coefficient (R) of 0.899 and weighted average of 1.2%. Similarly, the statistical analysis conducted on geographies consisting of 240,701,404 people shows a moderate negative correlation between the proportion of Immigrants from South Central Asia and percentage of population with a disability under the age of 5 in the United States with a correlation coefficient (R) of -0.458 and weighted average of 1.0%, a difference of 13.0%.
Disability Age Under 5 Correlation Summary
| Measurement | Immigrants from Australia | Immigrants from South Central Asia |
| Minimum | 0.73% | 0.13% |
| Maximum | 12.4% | 2.5% |
| Range | 11.7% | 2.3% |
| Mean | 3.5% | 1.0% |
| Median | 1.7% | 0.97% |
| Interquartile 25% (IQ1) | 1.0% | 0.72% |
| Interquartile 75% (IQ3) | 6.1% | 1.3% |
| Interquartile Range (IQR) | 5.1% | 0.59% |
| Standard Deviation (Sample) | 3.7% | 0.45% |
| Standard Deviation (Population) | 3.6% | 0.44% |
Similar Demographics by Disability Age Under 5
Demographics Similar to Immigrants from Australia by Disability Age Under 5
In terms of disability age under 5, the demographic groups most similar to Immigrants from Australia are Immigrants from Oceania (1.2%, a difference of 0.060%), Senegalese (1.2%, a difference of 0.11%), Belizean (1.2%, a difference of 0.21%), Immigrants from Caribbean (1.2%, a difference of 0.22%), and Immigrants from Northern Africa (1.2%, a difference of 0.24%).
| Demographics | Rating | Rank | Disability Age Under 5 |
| Immigrants | South Africa | 95.6 /100 | #105 | Exceptional 1.2% |
| Cambodians | 95.4 /100 | #106 | Exceptional 1.2% |
| Immigrants | West Indies | 95.3 /100 | #107 | Exceptional 1.2% |
| Iraqis | 95.1 /100 | #108 | Exceptional 1.2% |
| Immigrants | Panama | 95.0 /100 | #109 | Exceptional 1.2% |
| Immigrants | Lebanon | 95.0 /100 | #110 | Exceptional 1.2% |
| Senegalese | 94.6 /100 | #111 | Exceptional 1.2% |
| Immigrants | Australia | 94.4 /100 | #112 | Exceptional 1.2% |
| Immigrants | Oceania | 94.2 /100 | #113 | Exceptional 1.2% |
| Belizeans | 93.9 /100 | #114 | Exceptional 1.2% |
| Immigrants | Caribbean | 93.8 /100 | #115 | Exceptional 1.2% |
| Immigrants | Northern Africa | 93.8 /100 | #116 | Exceptional 1.2% |
| Immigrants | Philippines | 93.5 /100 | #117 | Exceptional 1.2% |
| Immigrants | Venezuela | 93.4 /100 | #118 | Exceptional 1.2% |
| Bhutanese | 92.5 /100 | #119 | Exceptional 1.2% |
Demographics Similar to Immigrants from South Central Asia by Disability Age Under 5
In terms of disability age under 5, the demographic groups most similar to Immigrants from South Central Asia are Armenian (1.0%, a difference of 0.28%), Iranian (1.0%, a difference of 0.33%), Bolivian (1.0%, a difference of 0.51%), Immigrants from Belarus (1.0%, a difference of 0.52%), and Immigrants from Ukraine (1.0%, a difference of 0.63%).
| Demographics | Rating | Rank | Disability Age Under 5 |
| Yakama | 100.0 /100 | #23 | Exceptional 1.00% |
| Indians (Asian) | 100.0 /100 | #24 | Exceptional 1.0% |
| Immigrants | Micronesia | 100.0 /100 | #25 | Exceptional 1.0% |
| Immigrants | Taiwan | 100.0 /100 | #26 | Exceptional 1.0% |
| Guyanese | 100.0 /100 | #27 | Exceptional 1.0% |
| Immigrants | Eastern Asia | 100.0 /100 | #28 | Exceptional 1.0% |
| Immigrants | Belarus | 100.0 /100 | #29 | Exceptional 1.0% |
| Immigrants | South Central Asia | 99.9 /100 | #30 | Exceptional 1.0% |
| Armenians | 99.9 /100 | #31 | Exceptional 1.0% |
| Iranians | 99.9 /100 | #32 | Exceptional 1.0% |
| Bolivians | 99.9 /100 | #33 | Exceptional 1.0% |
| Immigrants | Ukraine | 99.9 /100 | #34 | Exceptional 1.0% |
| Barbadians | 99.9 /100 | #35 | Exceptional 1.0% |
| Immigrants | Nepal | 99.9 /100 | #36 | Exceptional 1.0% |
| Immigrants | India | 99.9 /100 | #37 | Exceptional 1.0% |