Carpatho Rusyn vs Immigrants from Indonesia Hearing Disability
COMPARE
Carpatho Rusyn
Immigrants from Indonesia
Hearing Disability
Hearing Disability Comparison
Carpatho Rusyns
Immigrants from Indonesia
3.4%
HEARING DISABILITY
0.3/ 100
METRIC RATING
253rd/ 347
METRIC RANK
2.8%
HEARING DISABILITY
94.7/ 100
METRIC RATING
103rd/ 347
METRIC RANK
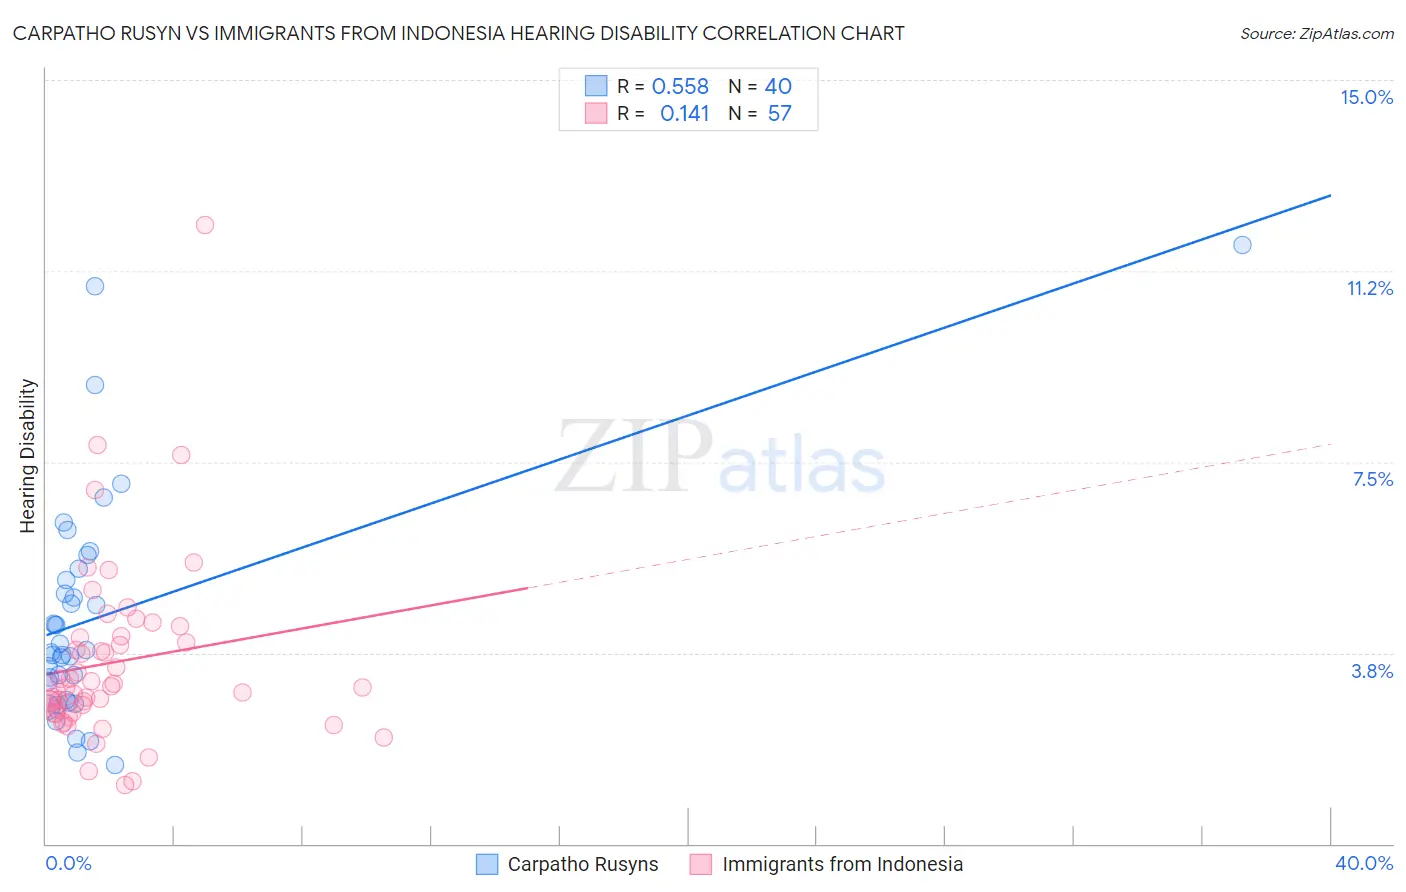
Carpatho Rusyn vs Immigrants from Indonesia Hearing Disability Correlation Chart
The statistical analysis conducted on geographies consisting of 58,869,507 people shows a substantial positive correlation between the proportion of Carpatho Rusyns and percentage of population with hearing disability in the United States with a correlation coefficient (R) of 0.558 and weighted average of 3.4%. Similarly, the statistical analysis conducted on geographies consisting of 215,771,622 people shows a poor positive correlation between the proportion of Immigrants from Indonesia and percentage of population with hearing disability in the United States with a correlation coefficient (R) of 0.141 and weighted average of 2.8%, a difference of 22.0%.
Hearing Disability Correlation Summary
| Measurement | Carpatho Rusyn | Immigrants from Indonesia |
| Minimum | 1.5% | 1.2% |
| Maximum | 11.8% | 12.2% |
| Range | 10.2% | 11.0% |
| Mean | 4.5% | 3.6% |
| Median | 3.8% | 3.1% |
| Interquartile 25% (IQ1) | 3.0% | 2.6% |
| Interquartile 75% (IQ3) | 5.3% | 4.1% |
| Interquartile Range (IQR) | 2.3% | 1.5% |
| Standard Deviation (Sample) | 2.2% | 1.8% |
| Standard Deviation (Population) | 2.2% | 1.8% |
Similar Demographics by Hearing Disability
Demographics Similar to Carpatho Rusyns by Hearing Disability
In terms of hearing disability, the demographic groups most similar to Carpatho Rusyns are Slavic (3.4%, a difference of 0.42%), Croatian (3.4%, a difference of 0.45%), Polish (3.4%, a difference of 0.65%), Hungarian (3.4%, a difference of 0.66%), and Hmong (3.4%, a difference of 0.70%).
| Demographics | Rating | Rank | Hearing Disability |
| Immigrants | England | 0.7 /100 | #246 | Tragic 3.3% |
| Lithuanians | 0.6 /100 | #247 | Tragic 3.4% |
| Austrians | 0.6 /100 | #248 | Tragic 3.4% |
| Italians | 0.4 /100 | #249 | Tragic 3.4% |
| Yuman | 0.4 /100 | #250 | Tragic 3.4% |
| Hungarians | 0.4 /100 | #251 | Tragic 3.4% |
| Croatians | 0.4 /100 | #252 | Tragic 3.4% |
| Carpatho Rusyns | 0.3 /100 | #253 | Tragic 3.4% |
| Slavs | 0.2 /100 | #254 | Tragic 3.4% |
| Poles | 0.2 /100 | #255 | Tragic 3.4% |
| Hmong | 0.2 /100 | #256 | Tragic 3.4% |
| Yaqui | 0.2 /100 | #257 | Tragic 3.4% |
| Northern Europeans | 0.2 /100 | #258 | Tragic 3.4% |
| Slovenes | 0.1 /100 | #259 | Tragic 3.5% |
| Portuguese | 0.1 /100 | #260 | Tragic 3.5% |
Demographics Similar to Immigrants from Indonesia by Hearing Disability
In terms of hearing disability, the demographic groups most similar to Immigrants from Indonesia are Taiwanese (2.8%, a difference of 0.050%), Immigrants from Spain (2.8%, a difference of 0.060%), Immigrants from Eastern Africa (2.8%, a difference of 0.12%), Immigrants from Guatemala (2.8%, a difference of 0.17%), and Immigrants from Honduras (2.8%, a difference of 0.21%).
| Demographics | Rating | Rank | Hearing Disability |
| Immigrants | Somalia | 95.5 /100 | #96 | Exceptional 2.8% |
| Immigrants | Afghanistan | 95.3 /100 | #97 | Exceptional 2.8% |
| Immigrants | Honduras | 95.1 /100 | #98 | Exceptional 2.8% |
| Immigrants | Guatemala | 95.1 /100 | #99 | Exceptional 2.8% |
| Immigrants | Eastern Africa | 95.0 /100 | #100 | Exceptional 2.8% |
| Immigrants | Spain | 94.9 /100 | #101 | Exceptional 2.8% |
| Taiwanese | 94.8 /100 | #102 | Exceptional 2.8% |
| Immigrants | Indonesia | 94.7 /100 | #103 | Exceptional 2.8% |
| Burmese | 94.2 /100 | #104 | Exceptional 2.8% |
| Moroccans | 93.9 /100 | #105 | Exceptional 2.8% |
| Hondurans | 93.4 /100 | #106 | Exceptional 2.8% |
| Immigrants | Chile | 93.4 /100 | #107 | Exceptional 2.8% |
| Guatemalans | 93.2 /100 | #108 | Exceptional 2.8% |
| Turks | 93.0 /100 | #109 | Exceptional 2.8% |
| Cypriots | 92.9 /100 | #110 | Exceptional 2.8% |