Fijian vs Immigrants from Europe Master's Degree
COMPARE
Fijian
Immigrants from Europe
Master's Degree
Master's Degree Comparison
Fijians
Immigrants from Europe
10.3%
MASTER'S DEGREE
0.0/ 100
METRIC RATING
330th/ 347
METRIC RANK
18.2%
MASTER'S DEGREE
99.9/ 100
METRIC RATING
61st/ 347
METRIC RANK
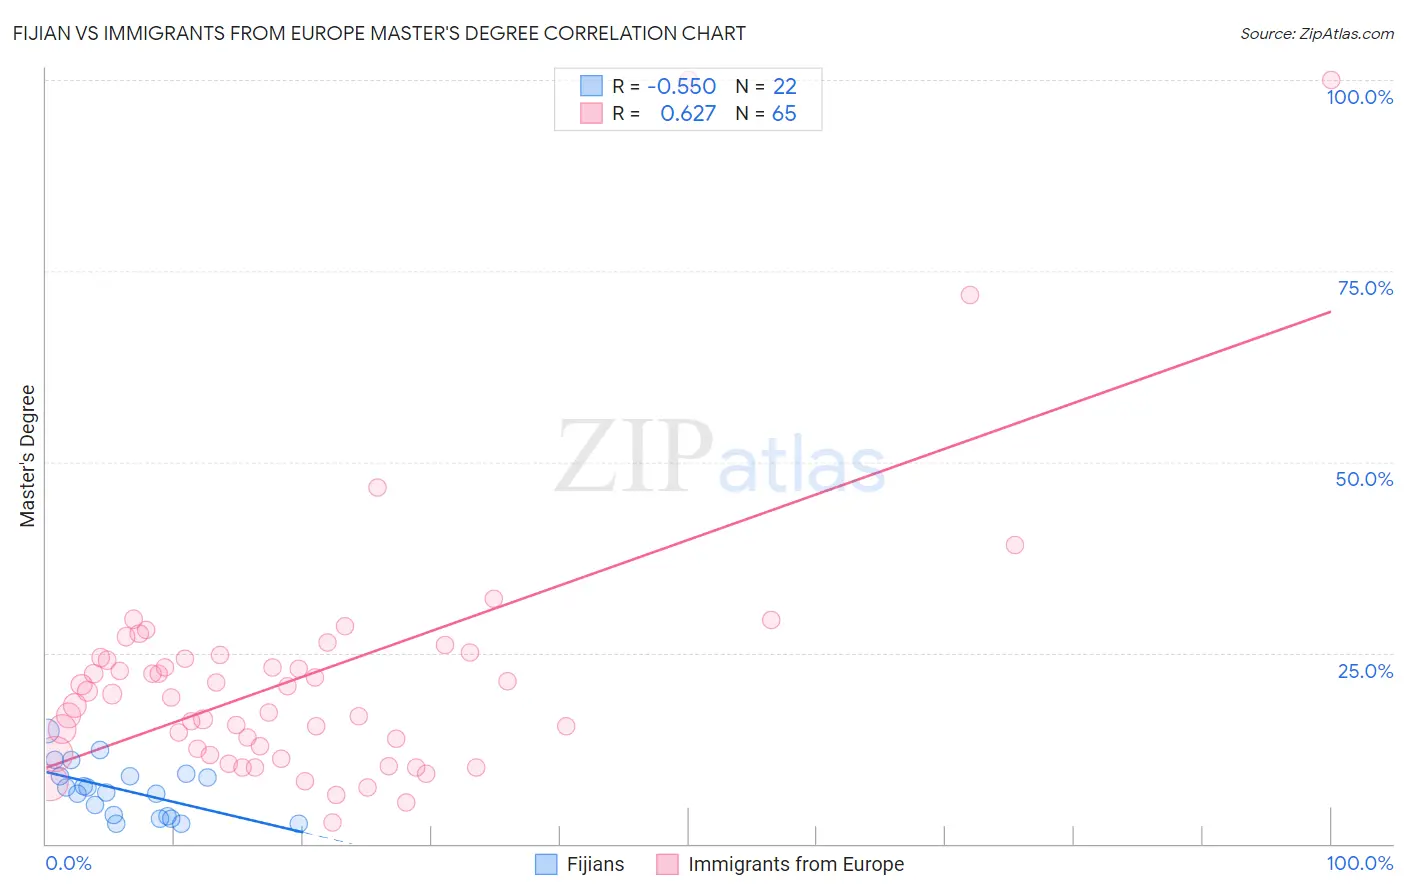
Fijian vs Immigrants from Europe Master's Degree Correlation Chart
The statistical analysis conducted on geographies consisting of 55,944,571 people shows a substantial negative correlation between the proportion of Fijians and percentage of population with at least master's degree education in the United States with a correlation coefficient (R) of -0.550 and weighted average of 10.3%. Similarly, the statistical analysis conducted on geographies consisting of 547,023,037 people shows a significant positive correlation between the proportion of Immigrants from Europe and percentage of population with at least master's degree education in the United States with a correlation coefficient (R) of 0.627 and weighted average of 18.2%, a difference of 77.2%.
Master's Degree Correlation Summary
| Measurement | Fijian | Immigrants from Europe |
| Minimum | 2.6% | 2.7% |
| Maximum | 14.8% | 100.0% |
| Range | 12.2% | 97.3% |
| Mean | 7.0% | 22.0% |
| Median | 7.1% | 19.6% |
| Interquartile 25% (IQ1) | 3.5% | 12.1% |
| Interquartile 75% (IQ3) | 8.9% | 24.5% |
| Interquartile Range (IQR) | 5.4% | 12.5% |
| Standard Deviation (Sample) | 3.4% | 17.5% |
| Standard Deviation (Population) | 3.4% | 17.3% |
Similar Demographics by Master's Degree
Demographics Similar to Fijians by Master's Degree
In terms of master's degree, the demographic groups most similar to Fijians are Pueblo (10.3%, a difference of 0.16%), Immigrants from the Azores (10.2%, a difference of 0.63%), Menominee (10.2%, a difference of 1.0%), Nepalese (10.5%, a difference of 1.7%), and Bangladeshi (10.5%, a difference of 1.8%).
| Demographics | Rating | Rank | Master's Degree |
| Crow | 0.0 /100 | #323 | Tragic 10.6% |
| Dutch West Indians | 0.0 /100 | #324 | Tragic 10.6% |
| Inupiat | 0.0 /100 | #325 | Tragic 10.5% |
| Creek | 0.0 /100 | #326 | Tragic 10.5% |
| Paiute | 0.0 /100 | #327 | Tragic 10.5% |
| Bangladeshis | 0.0 /100 | #328 | Tragic 10.5% |
| Nepalese | 0.0 /100 | #329 | Tragic 10.5% |
| Fijians | 0.0 /100 | #330 | Tragic 10.3% |
| Pueblo | 0.0 /100 | #331 | Tragic 10.3% |
| Immigrants | Azores | 0.0 /100 | #332 | Tragic 10.2% |
| Menominee | 0.0 /100 | #333 | Tragic 10.2% |
| Arapaho | 0.0 /100 | #334 | Tragic 10.0% |
| Immigrants | Central America | 0.0 /100 | #335 | Tragic 10.0% |
| Natives/Alaskans | 0.0 /100 | #336 | Tragic 9.9% |
| Mexicans | 0.0 /100 | #337 | Tragic 9.7% |
Demographics Similar to Immigrants from Europe by Master's Degree
In terms of master's degree, the demographic groups most similar to Immigrants from Europe are New Zealander (18.3%, a difference of 0.15%), Argentinean (18.2%, a difference of 0.36%), Immigrants from Bulgaria (18.3%, a difference of 0.38%), Immigrants from Netherlands (18.1%, a difference of 0.72%), and South African (18.1%, a difference of 0.80%).
| Demographics | Rating | Rank | Master's Degree |
| Immigrants | Lithuania | 99.9 /100 | #54 | Exceptional 18.5% |
| Immigrants | Serbia | 99.9 /100 | #55 | Exceptional 18.5% |
| Asians | 99.9 /100 | #56 | Exceptional 18.4% |
| Immigrants | Asia | 99.9 /100 | #57 | Exceptional 18.4% |
| Australians | 99.9 /100 | #58 | Exceptional 18.4% |
| Immigrants | Bulgaria | 99.9 /100 | #59 | Exceptional 18.3% |
| New Zealanders | 99.9 /100 | #60 | Exceptional 18.3% |
| Immigrants | Europe | 99.9 /100 | #61 | Exceptional 18.2% |
| Argentineans | 99.9 /100 | #62 | Exceptional 18.2% |
| Immigrants | Netherlands | 99.9 /100 | #63 | Exceptional 18.1% |
| South Africans | 99.9 /100 | #64 | Exceptional 18.1% |
| Immigrants | Kazakhstan | 99.8 /100 | #65 | Exceptional 18.0% |
| Ethiopians | 99.8 /100 | #66 | Exceptional 18.0% |
| Immigrants | Argentina | 99.8 /100 | #67 | Exceptional 18.0% |
| Immigrants | Ethiopia | 99.8 /100 | #68 | Exceptional 17.9% |