Fijian vs Choctaw 8th Grade
COMPARE
Fijian
Choctaw
8th Grade
8th Grade Comparison
Fijians
Choctaw
94.2%
8TH GRADE
0.0/ 100
METRIC RATING
295th/ 347
METRIC RANK
96.2%
8TH GRADE
94.0/ 100
METRIC RATING
126th/ 347
METRIC RANK
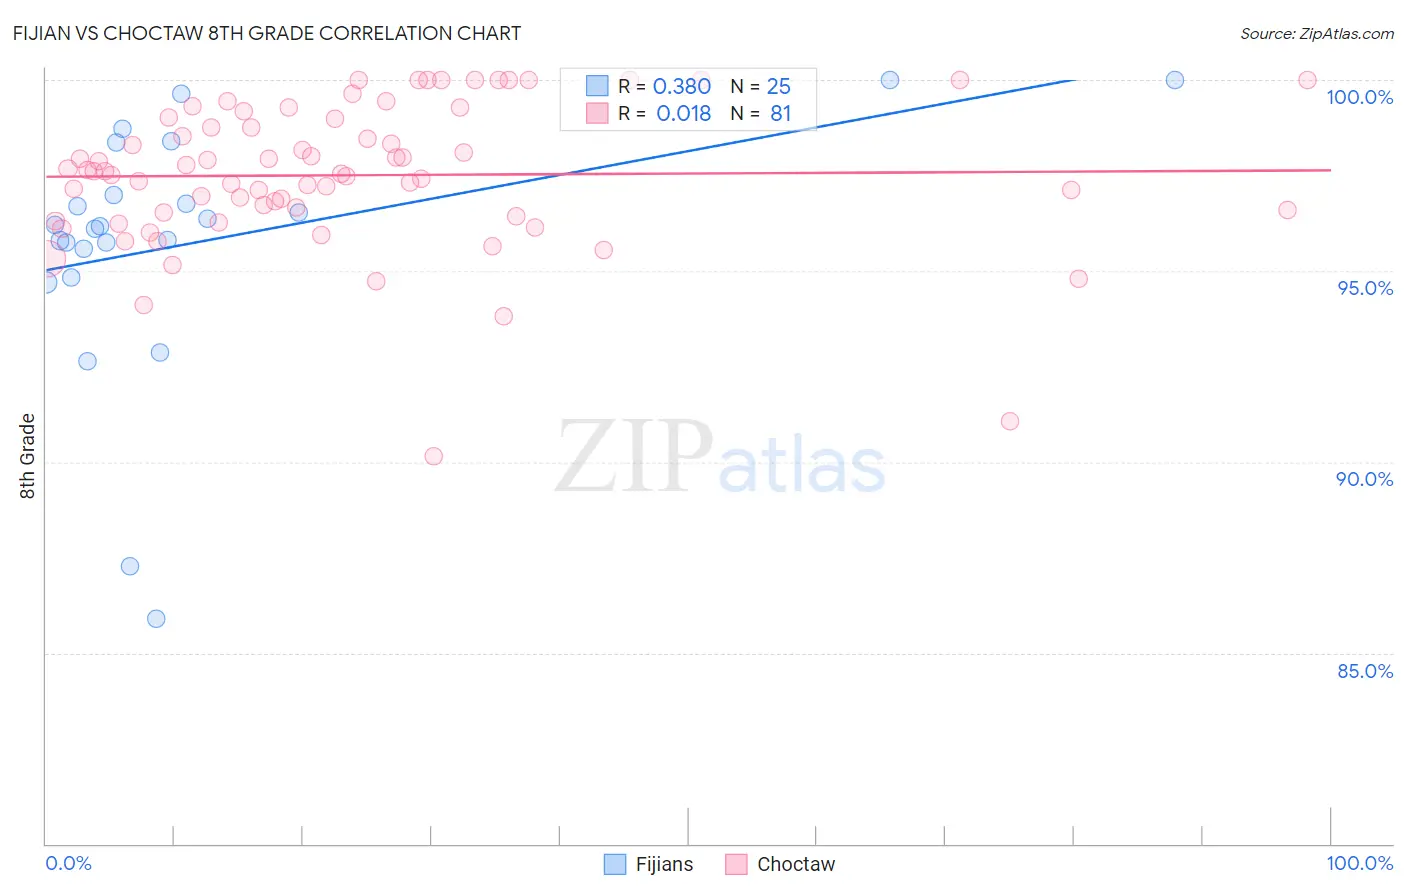
Fijian vs Choctaw 8th Grade Correlation Chart
The statistical analysis conducted on geographies consisting of 55,948,842 people shows a mild positive correlation between the proportion of Fijians and percentage of population with at least 8th grade education in the United States with a correlation coefficient (R) of 0.380 and weighted average of 94.2%. Similarly, the statistical analysis conducted on geographies consisting of 269,742,875 people shows no correlation between the proportion of Choctaw and percentage of population with at least 8th grade education in the United States with a correlation coefficient (R) of 0.018 and weighted average of 96.2%, a difference of 2.1%.
8th Grade Correlation Summary
| Measurement | Fijian | Choctaw |
| Minimum | 85.9% | 90.2% |
| Maximum | 100.0% | 100.0% |
| Range | 14.1% | 9.8% |
| Mean | 95.8% | 97.5% |
| Median | 96.2% | 97.6% |
| Interquartile 25% (IQ1) | 95.2% | 96.5% |
| Interquartile 75% (IQ3) | 97.7% | 99.0% |
| Interquartile Range (IQR) | 2.5% | 2.5% |
| Standard Deviation (Sample) | 3.3% | 1.9% |
| Standard Deviation (Population) | 3.3% | 1.9% |
Similar Demographics by 8th Grade
Demographics Similar to Fijians by 8th Grade
In terms of 8th grade, the demographic groups most similar to Fijians are Yaqui (94.2%, a difference of 0.010%), Houma (94.2%, a difference of 0.010%), Haitian (94.2%, a difference of 0.020%), Immigrants from South Eastern Asia (94.2%, a difference of 0.030%), and Bangladeshi (94.3%, a difference of 0.040%).
| Demographics | Rating | Rank | 8th Grade |
| Malaysians | 0.0 /100 | #288 | Tragic 94.5% |
| British West Indians | 0.0 /100 | #289 | Tragic 94.4% |
| Immigrants | West Indies | 0.0 /100 | #290 | Tragic 94.3% |
| Immigrants | Grenada | 0.0 /100 | #291 | Tragic 94.3% |
| Bangladeshis | 0.0 /100 | #292 | Tragic 94.3% |
| Yaqui | 0.0 /100 | #293 | Tragic 94.2% |
| Houma | 0.0 /100 | #294 | Tragic 94.2% |
| Fijians | 0.0 /100 | #295 | Tragic 94.2% |
| Haitians | 0.0 /100 | #296 | Tragic 94.2% |
| Immigrants | South Eastern Asia | 0.0 /100 | #297 | Tragic 94.2% |
| Indonesians | 0.0 /100 | #298 | Tragic 94.1% |
| Cubans | 0.0 /100 | #299 | Tragic 94.1% |
| Immigrants | Burma/Myanmar | 0.0 /100 | #300 | Tragic 94.1% |
| Immigrants | Laos | 0.0 /100 | #301 | Tragic 94.1% |
| Sri Lankans | 0.0 /100 | #302 | Tragic 94.0% |
Demographics Similar to Choctaw by 8th Grade
In terms of 8th grade, the demographic groups most similar to Choctaw are Immigrants from Romania (96.2%, a difference of 0.0%), Immigrants from Serbia (96.2%, a difference of 0.0%), Immigrants from Bosnia and Herzegovina (96.2%, a difference of 0.0%), Filipino (96.2%, a difference of 0.020%), and Palestinian (96.2%, a difference of 0.020%).
| Demographics | Rating | Rank | 8th Grade |
| Immigrants | Switzerland | 95.3 /100 | #119 | Exceptional 96.2% |
| Immigrants | France | 95.3 /100 | #120 | Exceptional 96.2% |
| Immigrants | Bulgaria | 95.3 /100 | #121 | Exceptional 96.2% |
| Immigrants | Europe | 95.3 /100 | #122 | Exceptional 96.2% |
| Filipinos | 94.6 /100 | #123 | Exceptional 96.2% |
| Palestinians | 94.6 /100 | #124 | Exceptional 96.2% |
| Immigrants | Romania | 94.1 /100 | #125 | Exceptional 96.2% |
| Choctaw | 94.0 /100 | #126 | Exceptional 96.2% |
| Immigrants | Serbia | 94.0 /100 | #127 | Exceptional 96.2% |
| Immigrants | Bosnia and Herzegovina | 93.9 /100 | #128 | Exceptional 96.2% |
| Cheyenne | 93.3 /100 | #129 | Exceptional 96.1% |
| Soviet Union | 92.6 /100 | #130 | Exceptional 96.1% |
| Pueblo | 92.3 /100 | #131 | Exceptional 96.1% |
| Immigrants | Kuwait | 92.2 /100 | #132 | Exceptional 96.1% |
| Immigrants | Turkey | 91.7 /100 | #133 | Exceptional 96.1% |