Immigrants from Japan vs Immigrants from Jamaica Ambulatory Disability
COMPARE
Immigrants from Japan
Immigrants from Jamaica
Ambulatory Disability
Ambulatory Disability Comparison
Immigrants from Japan
Immigrants from Jamaica
5.6%
AMBULATORY DISABILITY
99.9/ 100
METRIC RATING
47th/ 347
METRIC RANK
6.8%
AMBULATORY DISABILITY
0.0/ 100
METRIC RATING
284th/ 347
METRIC RANK
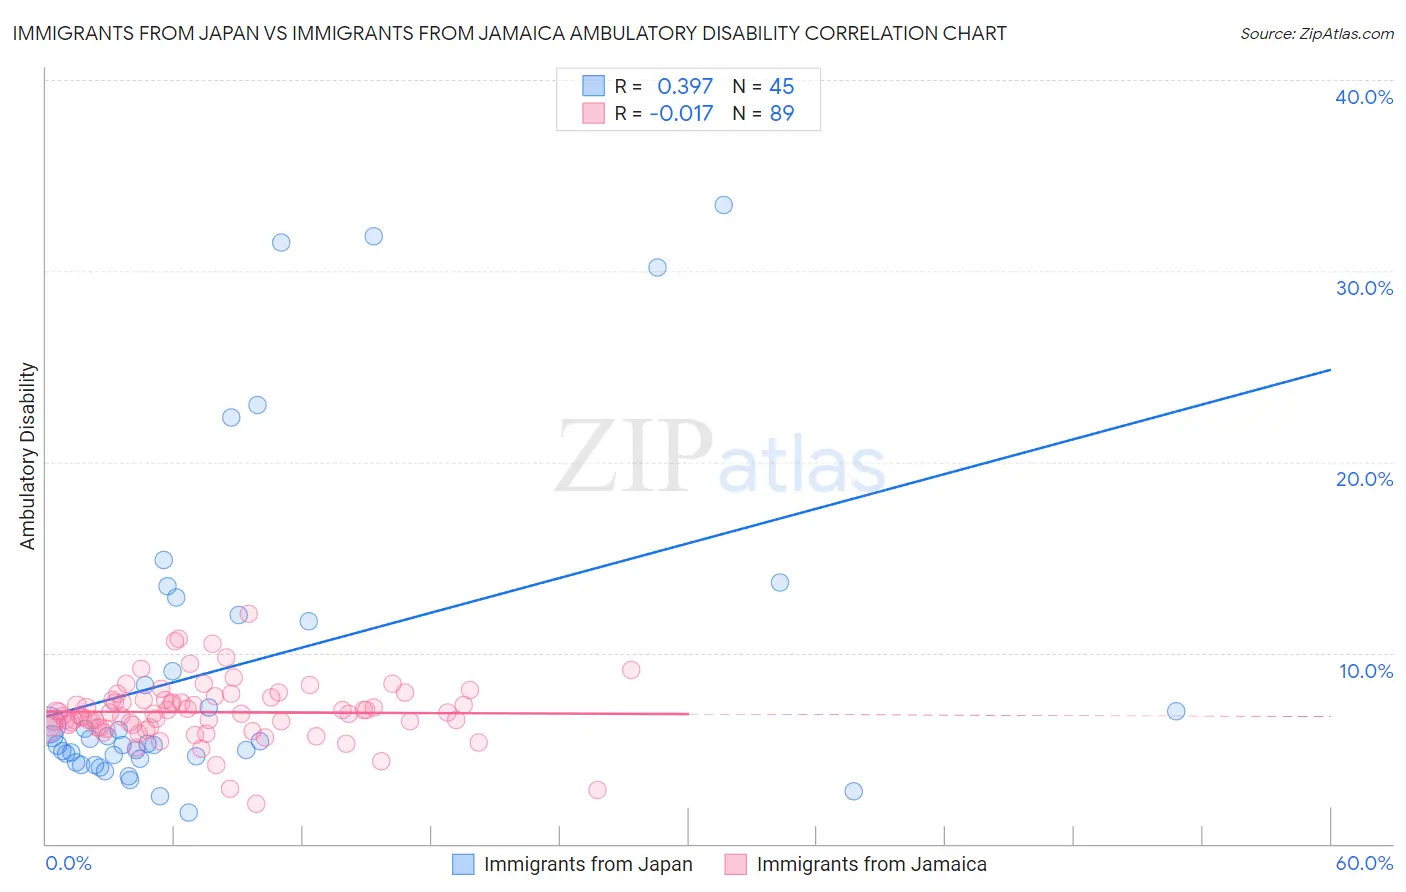
Immigrants from Japan vs Immigrants from Jamaica Ambulatory Disability Correlation Chart
The statistical analysis conducted on geographies consisting of 340,080,063 people shows a mild positive correlation between the proportion of Immigrants from Japan and percentage of population with ambulatory disability in the United States with a correlation coefficient (R) of 0.397 and weighted average of 5.6%. Similarly, the statistical analysis conducted on geographies consisting of 301,698,027 people shows no correlation between the proportion of Immigrants from Jamaica and percentage of population with ambulatory disability in the United States with a correlation coefficient (R) of -0.017 and weighted average of 6.8%, a difference of 22.0%.
Ambulatory Disability Correlation Summary
| Measurement | Immigrants from Japan | Immigrants from Jamaica |
| Minimum | 1.7% | 2.1% |
| Maximum | 33.4% | 12.0% |
| Range | 31.8% | 10.0% |
| Mean | 9.2% | 6.9% |
| Median | 5.4% | 6.8% |
| Interquartile 25% (IQ1) | 4.5% | 6.1% |
| Interquartile 75% (IQ3) | 11.8% | 7.5% |
| Interquartile Range (IQR) | 7.3% | 1.4% |
| Standard Deviation (Sample) | 8.5% | 1.6% |
| Standard Deviation (Population) | 8.4% | 1.6% |
Similar Demographics by Ambulatory Disability
Demographics Similar to Immigrants from Japan by Ambulatory Disability
In terms of ambulatory disability, the demographic groups most similar to Immigrants from Japan are Egyptian (5.6%, a difference of 0.0%), Immigrants from Sweden (5.6%, a difference of 0.010%), Immigrants from Argentina (5.6%, a difference of 0.010%), Immigrants from Indonesia (5.5%, a difference of 0.18%), and Bulgarian (5.6%, a difference of 0.21%).
| Demographics | Rating | Rank | Ambulatory Disability |
| Venezuelans | 99.9 /100 | #40 | Exceptional 5.5% |
| Mongolians | 99.9 /100 | #41 | Exceptional 5.5% |
| Argentineans | 99.9 /100 | #42 | Exceptional 5.5% |
| Paraguayans | 99.9 /100 | #43 | Exceptional 5.5% |
| Immigrants | Indonesia | 99.9 /100 | #44 | Exceptional 5.5% |
| Immigrants | Sweden | 99.9 /100 | #45 | Exceptional 5.6% |
| Egyptians | 99.9 /100 | #46 | Exceptional 5.6% |
| Immigrants | Japan | 99.9 /100 | #47 | Exceptional 5.6% |
| Immigrants | Argentina | 99.9 /100 | #48 | Exceptional 5.6% |
| Bulgarians | 99.9 /100 | #49 | Exceptional 5.6% |
| Luxembourgers | 99.9 /100 | #50 | Exceptional 5.6% |
| Taiwanese | 99.8 /100 | #51 | Exceptional 5.6% |
| Jordanians | 99.8 /100 | #52 | Exceptional 5.6% |
| Immigrants | Egypt | 99.8 /100 | #53 | Exceptional 5.6% |
| Immigrants | Eastern Africa | 99.8 /100 | #54 | Exceptional 5.6% |
Demographics Similar to Immigrants from Jamaica by Ambulatory Disability
In terms of ambulatory disability, the demographic groups most similar to Immigrants from Jamaica are Immigrants from Barbados (6.8%, a difference of 0.070%), Barbadian (6.8%, a difference of 0.23%), Yaqui (6.8%, a difference of 0.35%), Fijian (6.8%, a difference of 0.41%), and Pennsylvania German (6.8%, a difference of 0.42%).
| Demographics | Rating | Rank | Ambulatory Disability |
| Jamaicans | 0.1 /100 | #277 | Tragic 6.7% |
| Immigrants | West Indies | 0.1 /100 | #278 | Tragic 6.7% |
| Immigrants | Caribbean | 0.0 /100 | #279 | Tragic 6.7% |
| Pennsylvania Germans | 0.0 /100 | #280 | Tragic 6.8% |
| Yaqui | 0.0 /100 | #281 | Tragic 6.8% |
| Barbadians | 0.0 /100 | #282 | Tragic 6.8% |
| Immigrants | Barbados | 0.0 /100 | #283 | Tragic 6.8% |
| Immigrants | Jamaica | 0.0 /100 | #284 | Tragic 6.8% |
| Fijians | 0.0 /100 | #285 | Tragic 6.8% |
| Yakama | 0.0 /100 | #286 | Tragic 6.8% |
| U.S. Virgin Islanders | 0.0 /100 | #287 | Tragic 6.8% |
| Immigrants | Nonimmigrants | 0.0 /100 | #288 | Tragic 6.9% |
| Immigrants | Dominica | 0.0 /100 | #289 | Tragic 6.9% |
| Scotch-Irish | 0.0 /100 | #290 | Tragic 6.9% |
| West Indians | 0.0 /100 | #291 | Tragic 6.9% |