Immigrants from Turkey vs Immigrants from Jamaica Ambulatory Disability
COMPARE
Immigrants from Turkey
Immigrants from Jamaica
Ambulatory Disability
Ambulatory Disability Comparison
Immigrants from Turkey
Immigrants from Jamaica
5.4%
AMBULATORY DISABILITY
100.0/ 100
METRIC RATING
30th/ 347
METRIC RANK
6.8%
AMBULATORY DISABILITY
0.0/ 100
METRIC RATING
284th/ 347
METRIC RANK
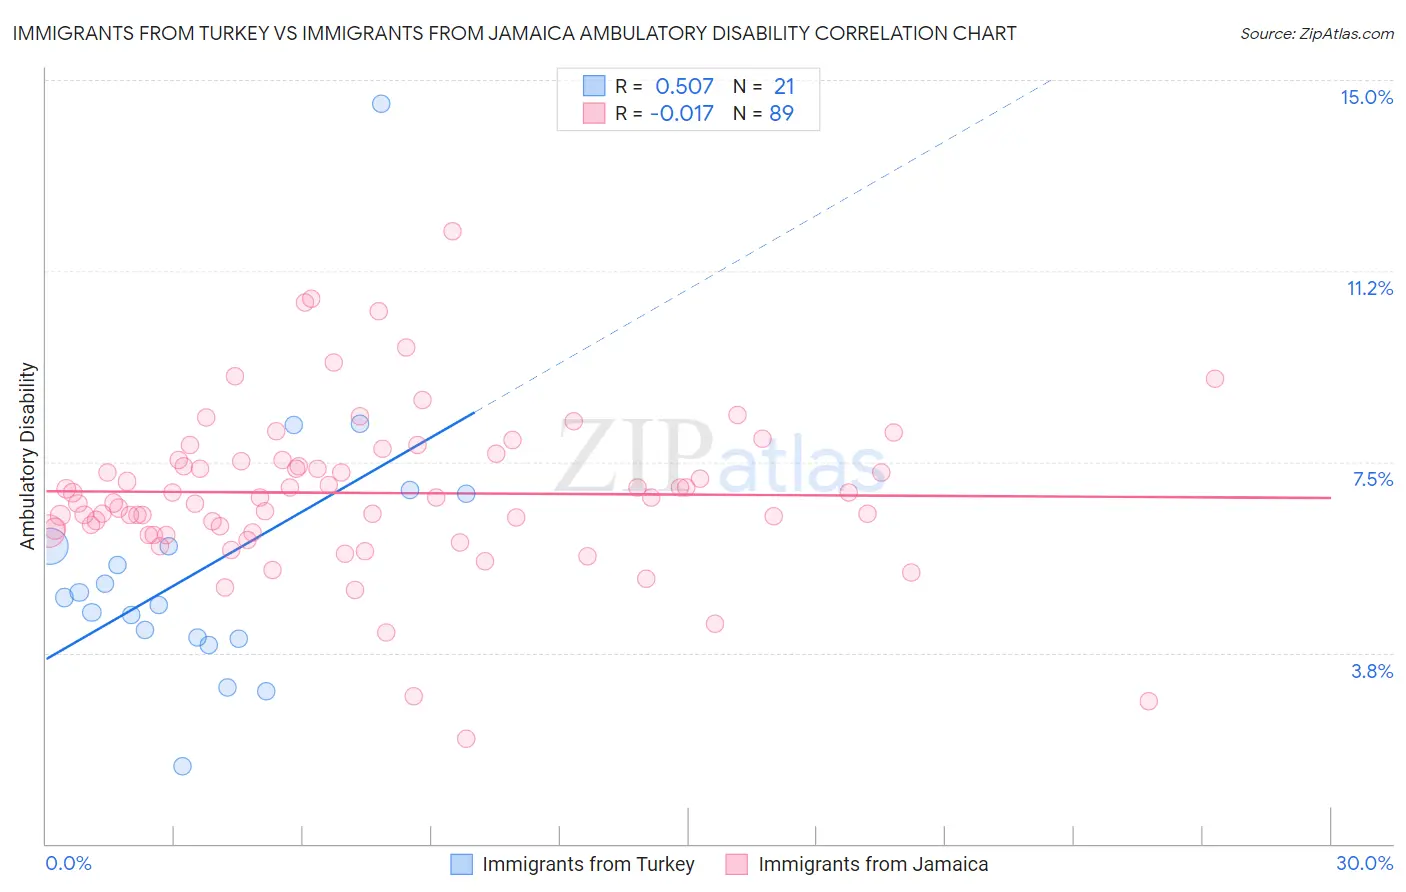
Immigrants from Turkey vs Immigrants from Jamaica Ambulatory Disability Correlation Chart
The statistical analysis conducted on geographies consisting of 223,019,564 people shows a substantial positive correlation between the proportion of Immigrants from Turkey and percentage of population with ambulatory disability in the United States with a correlation coefficient (R) of 0.507 and weighted average of 5.4%. Similarly, the statistical analysis conducted on geographies consisting of 301,698,027 people shows no correlation between the proportion of Immigrants from Jamaica and percentage of population with ambulatory disability in the United States with a correlation coefficient (R) of -0.017 and weighted average of 6.8%, a difference of 24.5%.
Ambulatory Disability Correlation Summary
| Measurement | Immigrants from Turkey | Immigrants from Jamaica |
| Minimum | 1.5% | 2.1% |
| Maximum | 14.5% | 12.0% |
| Range | 13.0% | 10.0% |
| Mean | 5.4% | 6.9% |
| Median | 4.8% | 6.8% |
| Interquartile 25% (IQ1) | 4.0% | 6.1% |
| Interquartile 75% (IQ3) | 6.4% | 7.5% |
| Interquartile Range (IQR) | 2.3% | 1.4% |
| Standard Deviation (Sample) | 2.7% | 1.6% |
| Standard Deviation (Population) | 2.6% | 1.6% |
Similar Demographics by Ambulatory Disability
Demographics Similar to Immigrants from Turkey by Ambulatory Disability
In terms of ambulatory disability, the demographic groups most similar to Immigrants from Turkey are Immigrants from Venezuela (5.4%, a difference of 0.020%), Immigrants from Australia (5.5%, a difference of 0.19%), Immigrants from Pakistan (5.5%, a difference of 0.31%), Immigrants from Asia (5.5%, a difference of 0.47%), and Afghan (5.5%, a difference of 0.51%).
| Demographics | Rating | Rank | Ambulatory Disability |
| Tongans | 100.0 /100 | #23 | Exceptional 5.4% |
| Immigrants | Saudi Arabia | 100.0 /100 | #24 | Exceptional 5.4% |
| Zimbabweans | 100.0 /100 | #25 | Exceptional 5.4% |
| Immigrants | Nepal | 100.0 /100 | #26 | Exceptional 5.4% |
| Asians | 100.0 /100 | #27 | Exceptional 5.4% |
| Cambodians | 100.0 /100 | #28 | Exceptional 5.4% |
| Immigrants | Iran | 100.0 /100 | #29 | Exceptional 5.4% |
| Immigrants | Turkey | 100.0 /100 | #30 | Exceptional 5.4% |
| Immigrants | Venezuela | 100.0 /100 | #31 | Exceptional 5.4% |
| Immigrants | Australia | 100.0 /100 | #32 | Exceptional 5.5% |
| Immigrants | Pakistan | 100.0 /100 | #33 | Exceptional 5.5% |
| Immigrants | Asia | 100.0 /100 | #34 | Exceptional 5.5% |
| Afghans | 100.0 /100 | #35 | Exceptional 5.5% |
| Immigrants | Malaysia | 100.0 /100 | #36 | Exceptional 5.5% |
| Turks | 100.0 /100 | #37 | Exceptional 5.5% |
Demographics Similar to Immigrants from Jamaica by Ambulatory Disability
In terms of ambulatory disability, the demographic groups most similar to Immigrants from Jamaica are Immigrants from Barbados (6.8%, a difference of 0.070%), Barbadian (6.8%, a difference of 0.23%), Yaqui (6.8%, a difference of 0.35%), Fijian (6.8%, a difference of 0.41%), and Pennsylvania German (6.8%, a difference of 0.42%).
| Demographics | Rating | Rank | Ambulatory Disability |
| Jamaicans | 0.1 /100 | #277 | Tragic 6.7% |
| Immigrants | West Indies | 0.1 /100 | #278 | Tragic 6.7% |
| Immigrants | Caribbean | 0.0 /100 | #279 | Tragic 6.7% |
| Pennsylvania Germans | 0.0 /100 | #280 | Tragic 6.8% |
| Yaqui | 0.0 /100 | #281 | Tragic 6.8% |
| Barbadians | 0.0 /100 | #282 | Tragic 6.8% |
| Immigrants | Barbados | 0.0 /100 | #283 | Tragic 6.8% |
| Immigrants | Jamaica | 0.0 /100 | #284 | Tragic 6.8% |
| Fijians | 0.0 /100 | #285 | Tragic 6.8% |
| Yakama | 0.0 /100 | #286 | Tragic 6.8% |
| U.S. Virgin Islanders | 0.0 /100 | #287 | Tragic 6.8% |
| Immigrants | Nonimmigrants | 0.0 /100 | #288 | Tragic 6.9% |
| Immigrants | Dominica | 0.0 /100 | #289 | Tragic 6.9% |
| Scotch-Irish | 0.0 /100 | #290 | Tragic 6.9% |
| West Indians | 0.0 /100 | #291 | Tragic 6.9% |