Swiss vs Immigrants from Jamaica Ambulatory Disability
COMPARE
Swiss
Immigrants from Jamaica
Ambulatory Disability
Ambulatory Disability Comparison
Swiss
Immigrants from Jamaica
6.1%
AMBULATORY DISABILITY
43.1/ 100
METRIC RATING
181st/ 347
METRIC RANK
6.8%
AMBULATORY DISABILITY
0.0/ 100
METRIC RATING
284th/ 347
METRIC RANK
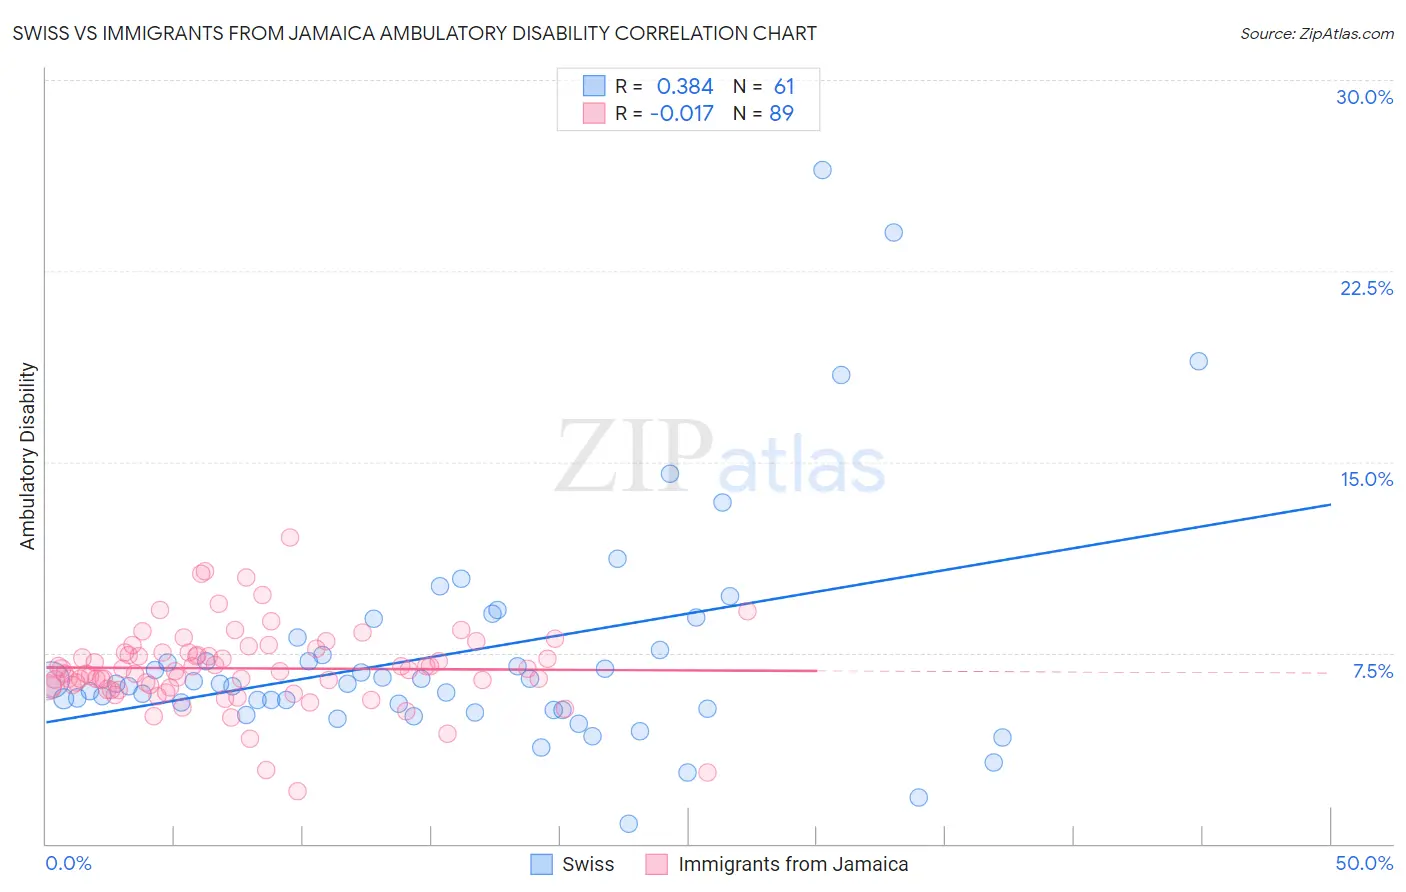
Swiss vs Immigrants from Jamaica Ambulatory Disability Correlation Chart
The statistical analysis conducted on geographies consisting of 464,822,088 people shows a mild positive correlation between the proportion of Swiss and percentage of population with ambulatory disability in the United States with a correlation coefficient (R) of 0.384 and weighted average of 6.1%. Similarly, the statistical analysis conducted on geographies consisting of 301,698,027 people shows no correlation between the proportion of Immigrants from Jamaica and percentage of population with ambulatory disability in the United States with a correlation coefficient (R) of -0.017 and weighted average of 6.8%, a difference of 10.4%.
Ambulatory Disability Correlation Summary
| Measurement | Swiss | Immigrants from Jamaica |
| Minimum | 0.81% | 2.1% |
| Maximum | 26.5% | 12.0% |
| Range | 25.7% | 10.0% |
| Mean | 7.5% | 6.9% |
| Median | 6.3% | 6.8% |
| Interquartile 25% (IQ1) | 5.3% | 6.1% |
| Interquartile 75% (IQ3) | 7.8% | 7.5% |
| Interquartile Range (IQR) | 2.6% | 1.4% |
| Standard Deviation (Sample) | 4.6% | 1.6% |
| Standard Deviation (Population) | 4.6% | 1.6% |
Similar Demographics by Ambulatory Disability
Demographics Similar to Swiss by Ambulatory Disability
In terms of ambulatory disability, the demographic groups most similar to Swiss are Serbian (6.1%, a difference of 0.010%), Immigrants from Nicaragua (6.1%, a difference of 0.040%), Austrian (6.1%, a difference of 0.050%), Immigrants from Thailand (6.1%, a difference of 0.050%), and Scandinavian (6.1%, a difference of 0.080%).
| Demographics | Rating | Rank | Ambulatory Disability |
| Immigrants | Canada | 50.0 /100 | #174 | Average 6.1% |
| Vietnamese | 47.2 /100 | #175 | Average 6.1% |
| Immigrants | North America | 45.6 /100 | #176 | Average 6.1% |
| Immigrants | England | 45.4 /100 | #177 | Average 6.1% |
| Scandinavians | 44.5 /100 | #178 | Average 6.1% |
| Austrians | 44.1 /100 | #179 | Average 6.1% |
| Immigrants | Nicaragua | 43.9 /100 | #180 | Average 6.1% |
| Swiss | 43.1 /100 | #181 | Average 6.1% |
| Serbians | 42.8 /100 | #182 | Average 6.1% |
| Immigrants | Thailand | 42.2 /100 | #183 | Average 6.1% |
| Immigrants | Ghana | 41.2 /100 | #184 | Average 6.1% |
| Immigrants | Bosnia and Herzegovina | 37.2 /100 | #185 | Fair 6.2% |
| Europeans | 36.2 /100 | #186 | Fair 6.2% |
| Carpatho Rusyns | 35.3 /100 | #187 | Fair 6.2% |
| British | 34.3 /100 | #188 | Fair 6.2% |
Demographics Similar to Immigrants from Jamaica by Ambulatory Disability
In terms of ambulatory disability, the demographic groups most similar to Immigrants from Jamaica are Immigrants from Barbados (6.8%, a difference of 0.070%), Barbadian (6.8%, a difference of 0.23%), Yaqui (6.8%, a difference of 0.35%), Fijian (6.8%, a difference of 0.41%), and Pennsylvania German (6.8%, a difference of 0.42%).
| Demographics | Rating | Rank | Ambulatory Disability |
| Jamaicans | 0.1 /100 | #277 | Tragic 6.7% |
| Immigrants | West Indies | 0.1 /100 | #278 | Tragic 6.7% |
| Immigrants | Caribbean | 0.0 /100 | #279 | Tragic 6.7% |
| Pennsylvania Germans | 0.0 /100 | #280 | Tragic 6.8% |
| Yaqui | 0.0 /100 | #281 | Tragic 6.8% |
| Barbadians | 0.0 /100 | #282 | Tragic 6.8% |
| Immigrants | Barbados | 0.0 /100 | #283 | Tragic 6.8% |
| Immigrants | Jamaica | 0.0 /100 | #284 | Tragic 6.8% |
| Fijians | 0.0 /100 | #285 | Tragic 6.8% |
| Yakama | 0.0 /100 | #286 | Tragic 6.8% |
| U.S. Virgin Islanders | 0.0 /100 | #287 | Tragic 6.8% |
| Immigrants | Nonimmigrants | 0.0 /100 | #288 | Tragic 6.9% |
| Immigrants | Dominica | 0.0 /100 | #289 | Tragic 6.9% |
| Scotch-Irish | 0.0 /100 | #290 | Tragic 6.9% |
| West Indians | 0.0 /100 | #291 | Tragic 6.9% |