Ethiopian vs Immigrants from Jamaica College, Under 1 year
COMPARE
Ethiopian
Immigrants from Jamaica
College, Under 1 year
College, Under 1 year Comparison
Ethiopians
Immigrants from Jamaica
68.3%
COLLEGE, UNDER 1 YEAR
98.2/ 100
METRIC RATING
89th/ 347
METRIC RANK
59.7%
COLLEGE, UNDER 1 YEAR
0.0/ 100
METRIC RATING
283rd/ 347
METRIC RANK
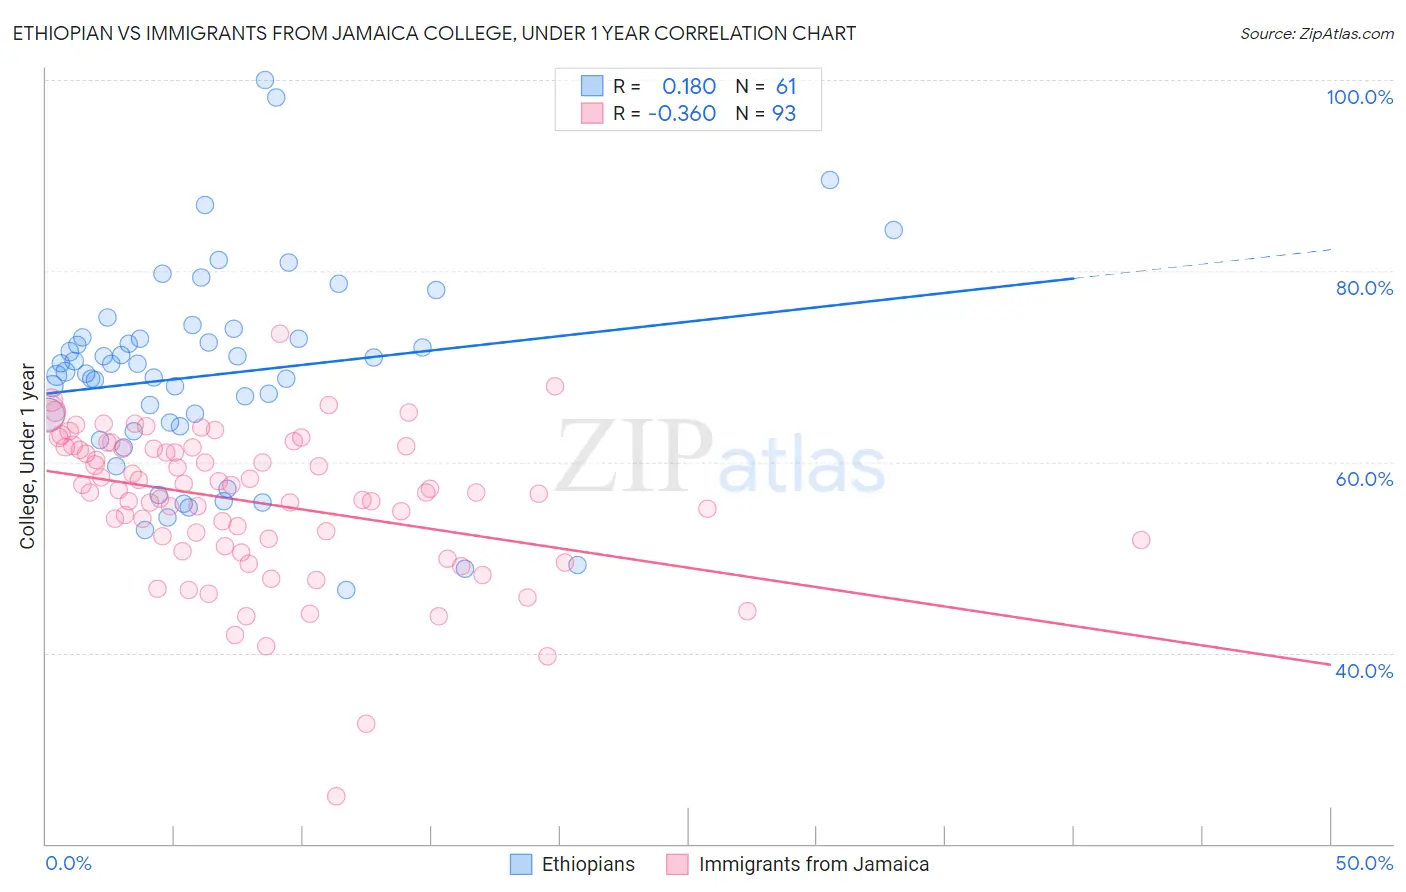
Ethiopian vs Immigrants from Jamaica College, Under 1 year Correlation Chart
The statistical analysis conducted on geographies consisting of 223,260,030 people shows a poor positive correlation between the proportion of Ethiopians and percentage of population with at least college, under 1 year education in the United States with a correlation coefficient (R) of 0.180 and weighted average of 68.3%. Similarly, the statistical analysis conducted on geographies consisting of 301,826,603 people shows a mild negative correlation between the proportion of Immigrants from Jamaica and percentage of population with at least college, under 1 year education in the United States with a correlation coefficient (R) of -0.360 and weighted average of 59.7%, a difference of 14.4%.
College, Under 1 year Correlation Summary
| Measurement | Ethiopian | Immigrants from Jamaica |
| Minimum | 46.6% | 24.9% |
| Maximum | 100.0% | 73.4% |
| Range | 53.4% | 48.5% |
| Mean | 69.1% | 55.8% |
| Median | 69.4% | 56.8% |
| Interquartile 25% (IQ1) | 63.5% | 51.5% |
| Interquartile 75% (IQ3) | 73.0% | 61.5% |
| Interquartile Range (IQR) | 9.5% | 10.0% |
| Standard Deviation (Sample) | 10.6% | 7.9% |
| Standard Deviation (Population) | 10.6% | 7.8% |
Similar Demographics by College, Under 1 year
Demographics Similar to Ethiopians by College, Under 1 year
In terms of college, under 1 year, the demographic groups most similar to Ethiopians are Croatian (68.3%, a difference of 0.010%), Chinese (68.3%, a difference of 0.030%), Immigrants from Lebanon (68.3%, a difference of 0.050%), Immigrants from Hungary (68.3%, a difference of 0.060%), and Egyptian (68.3%, a difference of 0.060%).
| Demographics | Rating | Rank | College, Under 1 year |
| Norwegians | 98.4 /100 | #82 | Exceptional 68.4% |
| Argentineans | 98.4 /100 | #83 | Exceptional 68.4% |
| Immigrants | Hungary | 98.3 /100 | #84 | Exceptional 68.3% |
| Egyptians | 98.3 /100 | #85 | Exceptional 68.3% |
| Immigrants | Lebanon | 98.3 /100 | #86 | Exceptional 68.3% |
| Chinese | 98.3 /100 | #87 | Exceptional 68.3% |
| Croatians | 98.2 /100 | #88 | Exceptional 68.3% |
| Ethiopians | 98.2 /100 | #89 | Exceptional 68.3% |
| Icelanders | 98.1 /100 | #90 | Exceptional 68.3% |
| Europeans | 98.1 /100 | #91 | Exceptional 68.2% |
| Luxembourgers | 98.1 /100 | #92 | Exceptional 68.2% |
| Romanians | 97.9 /100 | #93 | Exceptional 68.2% |
| Armenians | 97.7 /100 | #94 | Exceptional 68.1% |
| Immigrants | Pakistan | 97.5 /100 | #95 | Exceptional 68.0% |
| Jordanians | 97.4 /100 | #96 | Exceptional 68.0% |
Demographics Similar to Immigrants from Jamaica by College, Under 1 year
In terms of college, under 1 year, the demographic groups most similar to Immigrants from Jamaica are Immigrants from St. Vincent and the Grenadines (59.6%, a difference of 0.11%), Paiute (59.6%, a difference of 0.12%), British West Indian (59.5%, a difference of 0.27%), Sioux (59.4%, a difference of 0.44%), and Black/African American (59.4%, a difference of 0.54%).
| Demographics | Rating | Rank | College, Under 1 year |
| Arapaho | 0.1 /100 | #276 | Tragic 60.3% |
| Bahamians | 0.1 /100 | #277 | Tragic 60.3% |
| Yaqui | 0.1 /100 | #278 | Tragic 60.2% |
| Ute | 0.1 /100 | #279 | Tragic 60.2% |
| Crow | 0.1 /100 | #280 | Tragic 60.2% |
| Cherokee | 0.1 /100 | #281 | Tragic 60.1% |
| Belizeans | 0.1 /100 | #282 | Tragic 60.1% |
| Immigrants | Jamaica | 0.0 /100 | #283 | Tragic 59.7% |
| Immigrants | St. Vincent and the Grenadines | 0.0 /100 | #284 | Tragic 59.6% |
| Paiute | 0.0 /100 | #285 | Tragic 59.6% |
| British West Indians | 0.0 /100 | #286 | Tragic 59.5% |
| Sioux | 0.0 /100 | #287 | Tragic 59.4% |
| Blacks/African Americans | 0.0 /100 | #288 | Tragic 59.4% |
| Choctaw | 0.0 /100 | #289 | Tragic 59.3% |
| Ecuadorians | 0.0 /100 | #290 | Tragic 59.3% |