English vs Swiss Disability
COMPARE
English
Swiss
Disability
Disability Comparison
English
Swiss
13.0%
DISABILITY
0.0/ 100
METRIC RATING
286th/ 347
METRIC RANK
12.2%
DISABILITY
1.5/ 100
METRIC RATING
246th/ 347
METRIC RANK
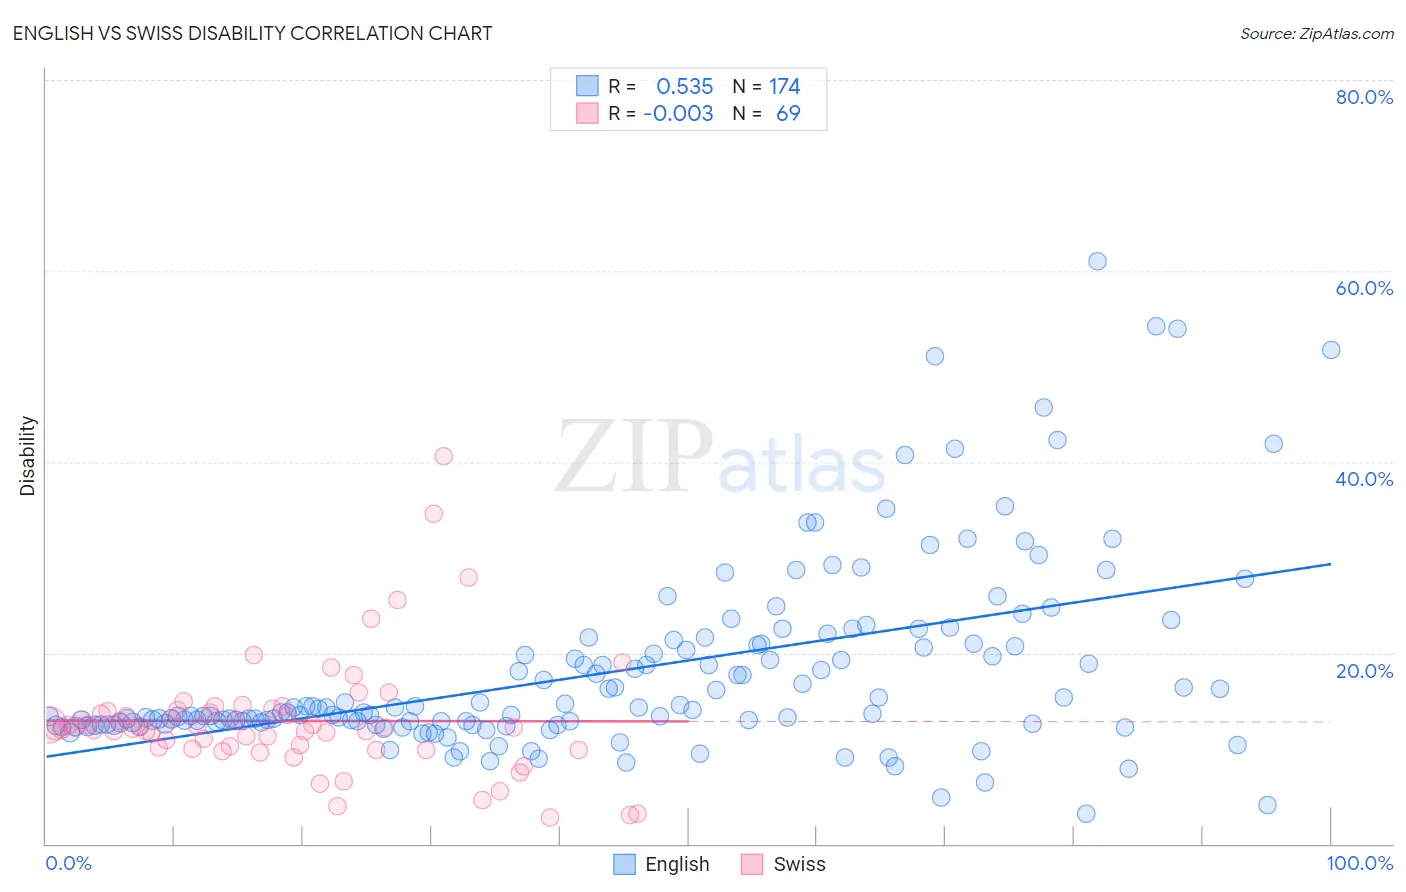
English vs Swiss Disability Correlation Chart
The statistical analysis conducted on geographies consisting of 579,766,165 people shows a substantial positive correlation between the proportion of English and percentage of population with a disability in the United States with a correlation coefficient (R) of 0.535 and weighted average of 13.0%. Similarly, the statistical analysis conducted on geographies consisting of 464,998,318 people shows no correlation between the proportion of Swiss and percentage of population with a disability in the United States with a correlation coefficient (R) of -0.003 and weighted average of 12.2%, a difference of 5.8%.
Disability Correlation Summary
| Measurement | English | Swiss |
| Minimum | 3.2% | 2.7% |
| Maximum | 61.0% | 40.6% |
| Range | 57.9% | 37.9% |
| Mean | 18.0% | 12.9% |
| Median | 13.7% | 12.1% |
| Interquartile 25% (IQ1) | 12.6% | 10.0% |
| Interquartile 75% (IQ3) | 20.9% | 13.9% |
| Interquartile Range (IQR) | 8.3% | 3.9% |
| Standard Deviation (Sample) | 9.9% | 6.3% |
| Standard Deviation (Population) | 9.9% | 6.2% |
Similar Demographics by Disability
Demographics Similar to English by Disability
In terms of disability, the demographic groups most similar to English are Crow (12.9%, a difference of 0.38%), Welsh (12.9%, a difference of 0.39%), African (13.0%, a difference of 0.41%), White/Caucasian (13.0%, a difference of 0.43%), and Slovak (13.0%, a difference of 0.44%).
| Demographics | Rating | Rank | Disability |
| Fijians | 0.0 /100 | #279 | Tragic 12.8% |
| Spanish | 0.0 /100 | #280 | Tragic 12.8% |
| Immigrants | Portugal | 0.0 /100 | #281 | Tragic 12.9% |
| Scottish | 0.0 /100 | #282 | Tragic 12.9% |
| Irish | 0.0 /100 | #283 | Tragic 12.9% |
| Welsh | 0.0 /100 | #284 | Tragic 12.9% |
| Crow | 0.0 /100 | #285 | Tragic 12.9% |
| English | 0.0 /100 | #286 | Tragic 13.0% |
| Africans | 0.0 /100 | #287 | Tragic 13.0% |
| Whites/Caucasians | 0.0 /100 | #288 | Tragic 13.0% |
| Slovaks | 0.0 /100 | #289 | Tragic 13.0% |
| Cheyenne | 0.0 /100 | #290 | Tragic 13.0% |
| Yaqui | 0.0 /100 | #291 | Tragic 13.1% |
| Aleuts | 0.0 /100 | #292 | Tragic 13.1% |
| Marshallese | 0.0 /100 | #293 | Tragic 13.1% |
Demographics Similar to Swiss by Disability
In terms of disability, the demographic groups most similar to Swiss are Liberian (12.2%, a difference of 0.030%), Indonesian (12.2%, a difference of 0.030%), British (12.2%, a difference of 0.040%), Basque (12.2%, a difference of 0.040%), and Guamanian/Chamorro (12.3%, a difference of 0.070%).
| Demographics | Rating | Rank | Disability |
| Swedes | 1.8 /100 | #239 | Tragic 12.2% |
| Hungarians | 1.7 /100 | #240 | Tragic 12.2% |
| Yugoslavians | 1.7 /100 | #241 | Tragic 12.2% |
| Poles | 1.7 /100 | #242 | Tragic 12.2% |
| British | 1.5 /100 | #243 | Tragic 12.2% |
| Basques | 1.5 /100 | #244 | Tragic 12.2% |
| Liberians | 1.5 /100 | #245 | Tragic 12.2% |
| Swiss | 1.5 /100 | #246 | Tragic 12.2% |
| Indonesians | 1.4 /100 | #247 | Tragic 12.2% |
| Guamanians/Chamorros | 1.4 /100 | #248 | Tragic 12.3% |
| Carpatho Rusyns | 1.4 /100 | #249 | Tragic 12.3% |
| Sub-Saharan Africans | 1.4 /100 | #250 | Tragic 12.3% |
| Europeans | 1.4 /100 | #251 | Tragic 12.3% |
| Bermudans | 1.1 /100 | #252 | Tragic 12.3% |
| Belgians | 0.8 /100 | #253 | Tragic 12.3% |