Egyptian vs Immigrants from Iran Seniors Poverty Over the Age of 65
COMPARE
Egyptian
Immigrants from Iran
Seniors Poverty Over the Age of 65
Seniors Poverty Over the Age of 65 Comparison
Egyptians
Immigrants from Iran
10.5%
SENIORS POVERTY OVER THE AGE OF 65
87.8/ 100
METRIC RATING
131st/ 347
METRIC RANK
10.4%
SENIORS POVERTY OVER THE AGE OF 65
88.4/ 100
METRIC RATING
129th/ 347
METRIC RANK
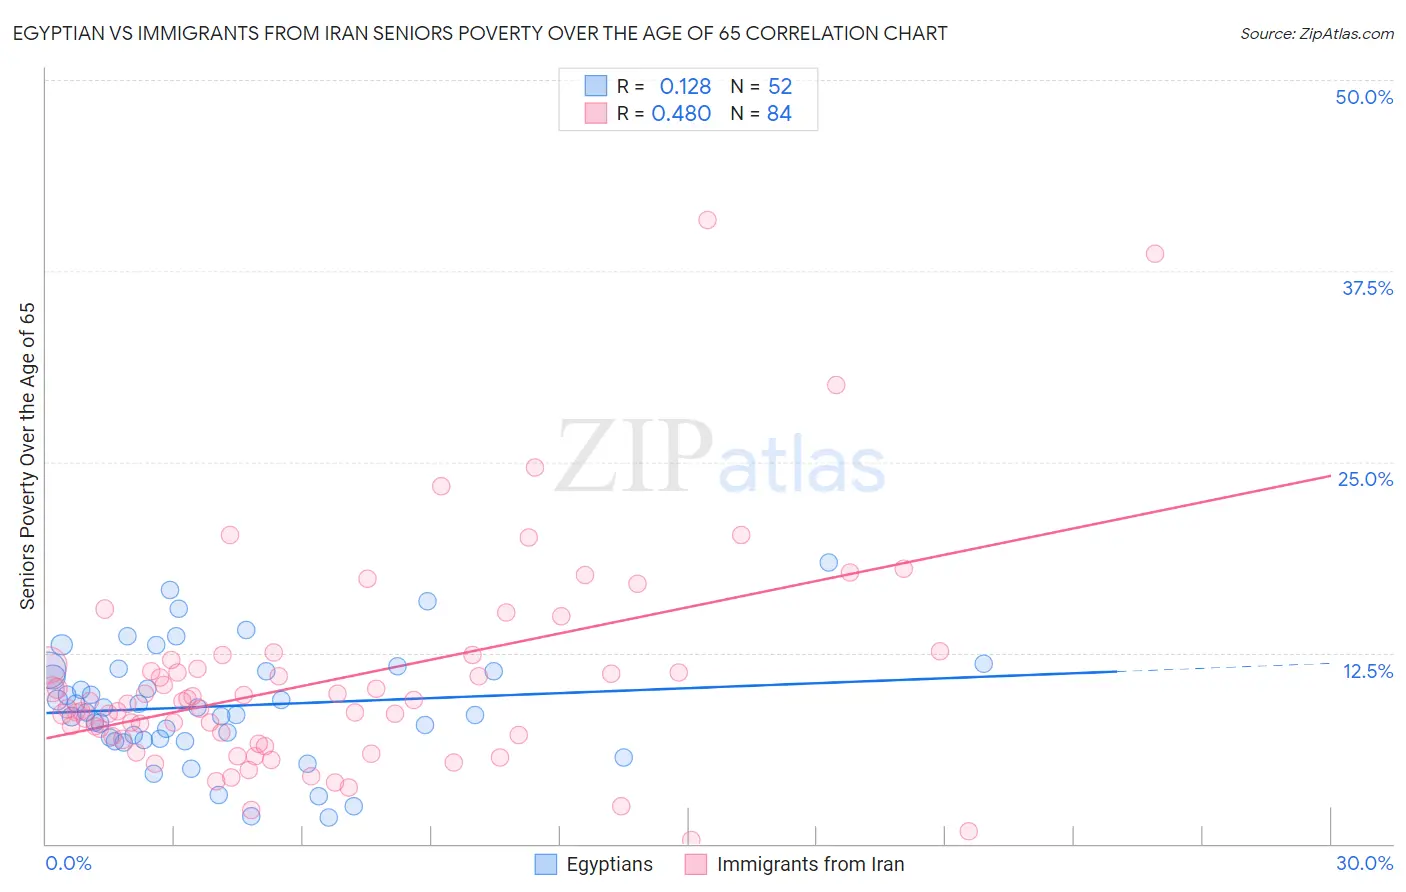
Egyptian vs Immigrants from Iran Seniors Poverty Over the Age of 65 Correlation Chart
The statistical analysis conducted on geographies consisting of 276,181,120 people shows a poor positive correlation between the proportion of Egyptians and poverty level among seniors over the age of 65 in the United States with a correlation coefficient (R) of 0.128 and weighted average of 10.5%. Similarly, the statistical analysis conducted on geographies consisting of 279,473,756 people shows a moderate positive correlation between the proportion of Immigrants from Iran and poverty level among seniors over the age of 65 in the United States with a correlation coefficient (R) of 0.480 and weighted average of 10.4%, a difference of 0.15%.
Seniors Poverty Over the Age of 65 Correlation Summary
| Measurement | Egyptian | Immigrants from Iran |
| Minimum | 1.7% | 0.21% |
| Maximum | 18.4% | 40.9% |
| Range | 16.7% | 40.7% |
| Mean | 9.0% | 10.7% |
| Median | 8.8% | 9.2% |
| Interquartile 25% (IQ1) | 6.8% | 6.9% |
| Interquartile 75% (IQ3) | 11.3% | 11.8% |
| Interquartile Range (IQR) | 4.5% | 4.9% |
| Standard Deviation (Sample) | 3.7% | 6.9% |
| Standard Deviation (Population) | 3.7% | 6.9% |
Demographics Similar to Egyptians and Immigrants from Iran by Seniors Poverty Over the Age of 65
In terms of seniors poverty over the age of 65, the demographic groups most similar to Egyptians are Immigrants from Turkey (10.5%, a difference of 0.010%), Guamanian/Chamorro (10.5%, a difference of 0.050%), Immigrants from Oceania (10.4%, a difference of 0.15%), Ottawa (10.4%, a difference of 0.17%), and Sierra Leonean (10.5%, a difference of 0.20%). Similarly, the demographic groups most similar to Immigrants from Iran are Immigrants from Oceania (10.4%, a difference of 0.0%), Ottawa (10.4%, a difference of 0.020%), Immigrants from Hungary (10.4%, a difference of 0.15%), Cambodian (10.4%, a difference of 0.15%), and Immigrants from Turkey (10.5%, a difference of 0.17%).
| Demographics | Rating | Rank | Seniors Poverty Over the Age of 65 |
| Immigrants | Bosnia and Herzegovina | 90.8 /100 | #120 | Exceptional 10.4% |
| Immigrants | Iraq | 90.7 /100 | #121 | Exceptional 10.4% |
| Immigrants | Moldova | 90.7 /100 | #122 | Exceptional 10.4% |
| Hmong | 90.0 /100 | #123 | Exceptional 10.4% |
| Asians | 89.9 /100 | #124 | Excellent 10.4% |
| Immigrants | Philippines | 89.4 /100 | #125 | Excellent 10.4% |
| Immigrants | Hungary | 89.1 /100 | #126 | Excellent 10.4% |
| Cambodians | 89.1 /100 | #127 | Excellent 10.4% |
| Ottawa | 88.5 /100 | #128 | Excellent 10.4% |
| Immigrants | Iran | 88.4 /100 | #129 | Excellent 10.4% |
| Immigrants | Oceania | 88.4 /100 | #130 | Excellent 10.4% |
| Egyptians | 87.8 /100 | #131 | Excellent 10.5% |
| Immigrants | Turkey | 87.7 /100 | #132 | Excellent 10.5% |
| Guamanians/Chamorros | 87.5 /100 | #133 | Excellent 10.5% |
| Sierra Leoneans | 86.8 /100 | #134 | Excellent 10.5% |
| Immigrants | Norway | 86.5 /100 | #135 | Excellent 10.5% |
| Immigrants | Serbia | 86.4 /100 | #136 | Excellent 10.5% |
| Immigrants | Australia | 85.1 /100 | #137 | Excellent 10.5% |
| Immigrants | Latvia | 84.7 /100 | #138 | Excellent 10.5% |
| Portuguese | 84.1 /100 | #139 | Excellent 10.5% |
| Immigrants | Kenya | 83.4 /100 | #140 | Excellent 10.5% |