Egyptian vs Immigrants from Venezuela Disability Age Under 5
COMPARE
Egyptian
Immigrants from Venezuela
Disability Age Under 5
Disability Age Under 5 Comparison
Egyptians
Immigrants from Venezuela
1.1%
DISABILITY AGE UNDER 5
98.9/ 100
METRIC RATING
64th/ 347
METRIC RANK
1.2%
DISABILITY AGE UNDER 5
93.4/ 100
METRIC RATING
118th/ 347
METRIC RANK
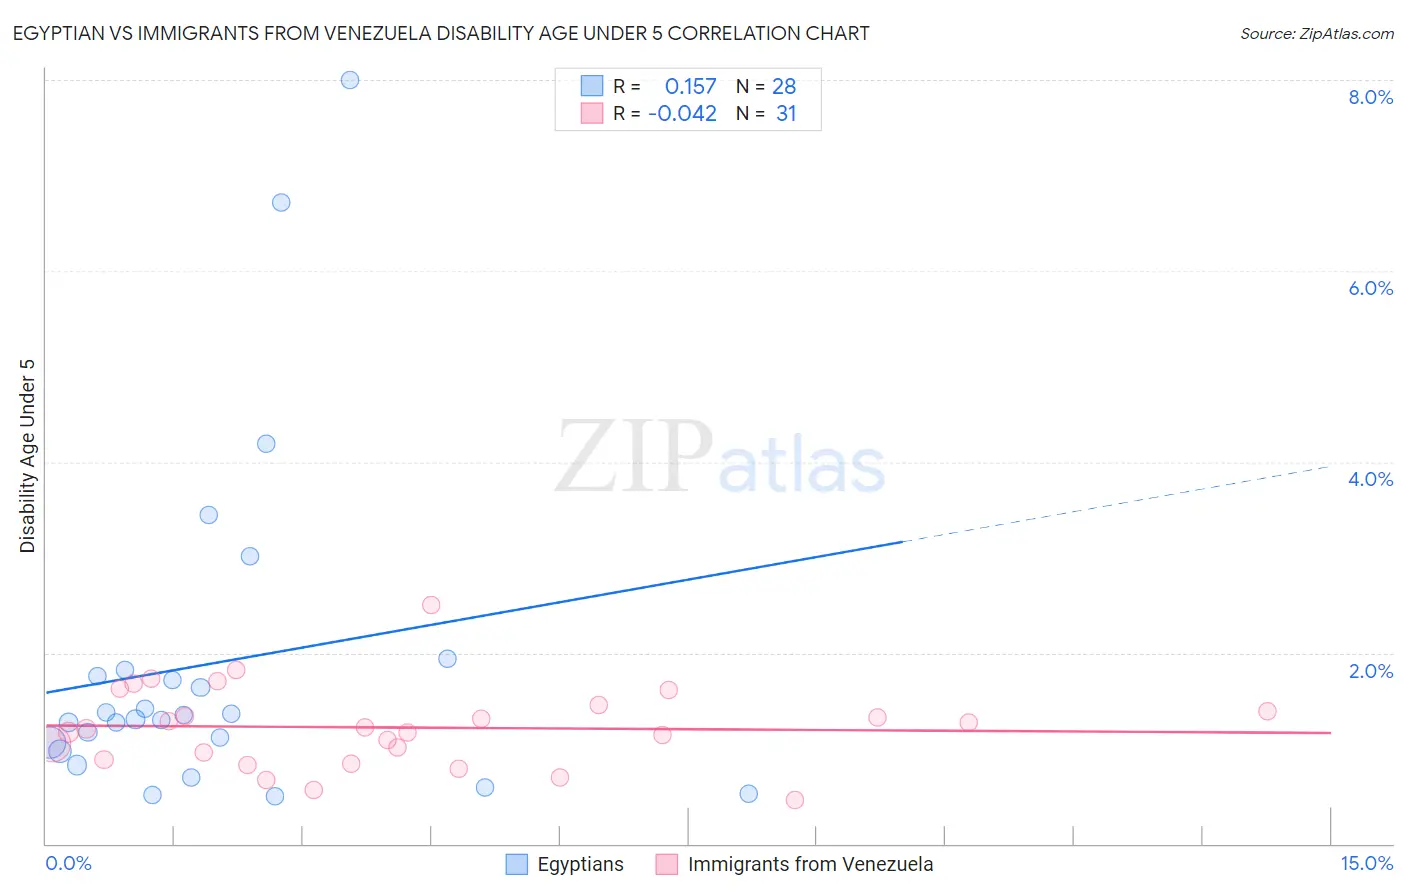
Egyptian vs Immigrants from Venezuela Disability Age Under 5 Correlation Chart
The statistical analysis conducted on geographies consisting of 167,621,034 people shows a poor positive correlation between the proportion of Egyptians and percentage of population with a disability under the age of 5 in the United States with a correlation coefficient (R) of 0.157 and weighted average of 1.1%. Similarly, the statistical analysis conducted on geographies consisting of 173,759,637 people shows no correlation between the proportion of Immigrants from Venezuela and percentage of population with a disability under the age of 5 in the United States with a correlation coefficient (R) of -0.042 and weighted average of 1.2%, a difference of 4.8%.
Disability Age Under 5 Correlation Summary
| Measurement | Egyptian | Immigrants from Venezuela |
| Minimum | 0.49% | 0.46% |
| Maximum | 8.0% | 2.5% |
| Range | 7.5% | 2.0% |
| Mean | 1.9% | 1.2% |
| Median | 1.3% | 1.2% |
| Interquartile 25% (IQ1) | 1.0% | 0.88% |
| Interquartile 75% (IQ3) | 1.8% | 1.4% |
| Interquartile Range (IQR) | 0.77% | 0.57% |
| Standard Deviation (Sample) | 1.8% | 0.43% |
| Standard Deviation (Population) | 1.7% | 0.42% |
Similar Demographics by Disability Age Under 5
Demographics Similar to Egyptians by Disability Age Under 5
In terms of disability age under 5, the demographic groups most similar to Egyptians are Immigrants from Korea (1.1%, a difference of 0.34%), Immigrants from Vietnam (1.1%, a difference of 0.46%), Immigrants from Indonesia (1.1%, a difference of 0.46%), Immigrants from Belize (1.1%, a difference of 0.53%), and Immigrants from Switzerland (1.1%, a difference of 0.57%).
| Demographics | Rating | Rank | Disability Age Under 5 |
| Assyrians/Chaldeans/Syriacs | 99.5 /100 | #57 | Exceptional 1.1% |
| Immigrants | Egypt | 99.4 /100 | #58 | Exceptional 1.1% |
| Immigrants | Malaysia | 99.4 /100 | #59 | Exceptional 1.1% |
| Immigrants | Western Asia | 99.2 /100 | #60 | Exceptional 1.1% |
| Immigrants | Ethiopia | 99.2 /100 | #61 | Exceptional 1.1% |
| Immigrants | Switzerland | 99.2 /100 | #62 | Exceptional 1.1% |
| Immigrants | Vietnam | 99.1 /100 | #63 | Exceptional 1.1% |
| Egyptians | 98.9 /100 | #64 | Exceptional 1.1% |
| Immigrants | Korea | 98.8 /100 | #65 | Exceptional 1.1% |
| Immigrants | Indonesia | 98.7 /100 | #66 | Exceptional 1.1% |
| Immigrants | Belize | 98.7 /100 | #67 | Exceptional 1.1% |
| South Africans | 98.7 /100 | #68 | Exceptional 1.1% |
| Israelis | 98.7 /100 | #69 | Exceptional 1.1% |
| Immigrants | Ecuador | 98.6 /100 | #70 | Exceptional 1.1% |
| Trinidadians and Tobagonians | 98.6 /100 | #71 | Exceptional 1.1% |
Demographics Similar to Immigrants from Venezuela by Disability Age Under 5
In terms of disability age under 5, the demographic groups most similar to Immigrants from Venezuela are Immigrants from Philippines (1.2%, a difference of 0.030%), Immigrants from Northern Africa (1.2%, a difference of 0.17%), Immigrants from Caribbean (1.2%, a difference of 0.19%), Belizean (1.2%, a difference of 0.20%), and Bhutanese (1.2%, a difference of 0.34%).
| Demographics | Rating | Rank | Disability Age Under 5 |
| Senegalese | 94.6 /100 | #111 | Exceptional 1.2% |
| Immigrants | Australia | 94.4 /100 | #112 | Exceptional 1.2% |
| Immigrants | Oceania | 94.2 /100 | #113 | Exceptional 1.2% |
| Belizeans | 93.9 /100 | #114 | Exceptional 1.2% |
| Immigrants | Caribbean | 93.8 /100 | #115 | Exceptional 1.2% |
| Immigrants | Northern Africa | 93.8 /100 | #116 | Exceptional 1.2% |
| Immigrants | Philippines | 93.5 /100 | #117 | Exceptional 1.2% |
| Immigrants | Venezuela | 93.4 /100 | #118 | Exceptional 1.2% |
| Bhutanese | 92.5 /100 | #119 | Exceptional 1.2% |
| Immigrants | Eritrea | 92.3 /100 | #120 | Exceptional 1.2% |
| Immigrants | Senegal | 91.4 /100 | #121 | Exceptional 1.2% |
| Aleuts | 90.7 /100 | #122 | Exceptional 1.2% |
| Zimbabweans | 90.6 /100 | #123 | Exceptional 1.2% |
| Immigrants | Cambodia | 90.5 /100 | #124 | Exceptional 1.2% |
| Japanese | 90.3 /100 | #125 | Exceptional 1.2% |