Egyptian vs Colombian Disability Age Under 5
COMPARE
Egyptian
Colombian
Disability Age Under 5
Disability Age Under 5 Comparison
Egyptians
Colombians
1.1%
DISABILITY AGE UNDER 5
98.9/ 100
METRIC RATING
64th/ 347
METRIC RANK
1.2%
DISABILITY AGE UNDER 5
65.8/ 100
METRIC RATING
159th/ 347
METRIC RANK
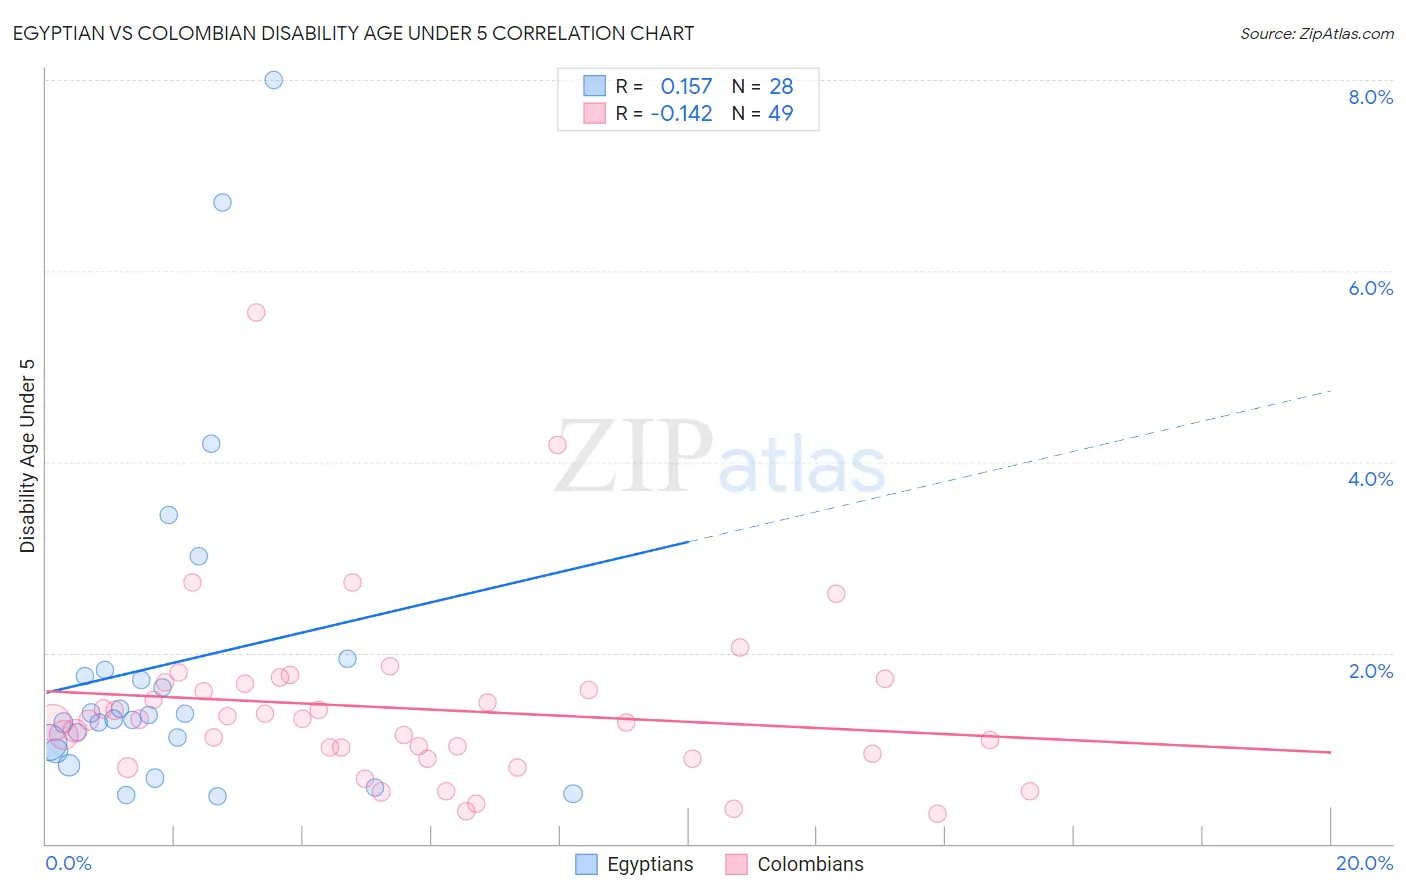
Egyptian vs Colombian Disability Age Under 5 Correlation Chart
The statistical analysis conducted on geographies consisting of 167,621,034 people shows a poor positive correlation between the proportion of Egyptians and percentage of population with a disability under the age of 5 in the United States with a correlation coefficient (R) of 0.157 and weighted average of 1.1%. Similarly, the statistical analysis conducted on geographies consisting of 225,886,034 people shows a poor negative correlation between the proportion of Colombians and percentage of population with a disability under the age of 5 in the United States with a correlation coefficient (R) of -0.142 and weighted average of 1.2%, a difference of 9.8%.
Disability Age Under 5 Correlation Summary
| Measurement | Egyptian | Colombian |
| Minimum | 0.49% | 0.32% |
| Maximum | 8.0% | 5.6% |
| Range | 7.5% | 5.2% |
| Mean | 1.9% | 1.4% |
| Median | 1.3% | 1.3% |
| Interquartile 25% (IQ1) | 1.0% | 0.92% |
| Interquartile 75% (IQ3) | 1.8% | 1.7% |
| Interquartile Range (IQR) | 0.77% | 0.77% |
| Standard Deviation (Sample) | 1.8% | 0.92% |
| Standard Deviation (Population) | 1.7% | 0.91% |
Similar Demographics by Disability Age Under 5
Demographics Similar to Egyptians by Disability Age Under 5
In terms of disability age under 5, the demographic groups most similar to Egyptians are Immigrants from Korea (1.1%, a difference of 0.34%), Immigrants from Vietnam (1.1%, a difference of 0.46%), Immigrants from Indonesia (1.1%, a difference of 0.46%), Immigrants from Belize (1.1%, a difference of 0.53%), and Immigrants from Switzerland (1.1%, a difference of 0.57%).
| Demographics | Rating | Rank | Disability Age Under 5 |
| Assyrians/Chaldeans/Syriacs | 99.5 /100 | #57 | Exceptional 1.1% |
| Immigrants | Egypt | 99.4 /100 | #58 | Exceptional 1.1% |
| Immigrants | Malaysia | 99.4 /100 | #59 | Exceptional 1.1% |
| Immigrants | Western Asia | 99.2 /100 | #60 | Exceptional 1.1% |
| Immigrants | Ethiopia | 99.2 /100 | #61 | Exceptional 1.1% |
| Immigrants | Switzerland | 99.2 /100 | #62 | Exceptional 1.1% |
| Immigrants | Vietnam | 99.1 /100 | #63 | Exceptional 1.1% |
| Egyptians | 98.9 /100 | #64 | Exceptional 1.1% |
| Immigrants | Korea | 98.8 /100 | #65 | Exceptional 1.1% |
| Immigrants | Indonesia | 98.7 /100 | #66 | Exceptional 1.1% |
| Immigrants | Belize | 98.7 /100 | #67 | Exceptional 1.1% |
| South Africans | 98.7 /100 | #68 | Exceptional 1.1% |
| Israelis | 98.7 /100 | #69 | Exceptional 1.1% |
| Immigrants | Ecuador | 98.6 /100 | #70 | Exceptional 1.1% |
| Trinidadians and Tobagonians | 98.6 /100 | #71 | Exceptional 1.1% |
Demographics Similar to Colombians by Disability Age Under 5
In terms of disability age under 5, the demographic groups most similar to Colombians are Immigrants from Latin America (1.2%, a difference of 0.0%), Arab (1.2%, a difference of 0.060%), Immigrants from Africa (1.2%, a difference of 0.070%), Immigrants from South America (1.2%, a difference of 0.12%), and Guatemalan (1.2%, a difference of 0.22%).
| Demographics | Rating | Rank | Disability Age Under 5 |
| Hondurans | 72.5 /100 | #152 | Good 1.2% |
| Immigrants | Thailand | 69.4 /100 | #153 | Good 1.2% |
| Uruguayans | 68.8 /100 | #154 | Good 1.2% |
| Immigrants | Ghana | 68.7 /100 | #155 | Good 1.2% |
| Hawaiians | 68.5 /100 | #156 | Good 1.2% |
| Immigrants | South America | 67.0 /100 | #157 | Good 1.2% |
| Arabs | 66.4 /100 | #158 | Good 1.2% |
| Colombians | 65.8 /100 | #159 | Good 1.2% |
| Immigrants | Latin America | 65.8 /100 | #160 | Good 1.2% |
| Immigrants | Africa | 65.1 /100 | #161 | Good 1.2% |
| Guatemalans | 63.6 /100 | #162 | Good 1.2% |
| Immigrants | Guatemala | 63.2 /100 | #163 | Good 1.2% |
| Laotians | 62.8 /100 | #164 | Good 1.2% |
| Immigrants | Kuwait | 62.6 /100 | #165 | Good 1.2% |
| Immigrants | Central America | 61.4 /100 | #166 | Good 1.2% |