Egyptian vs Immigrants from Fiji Vision Disability
COMPARE
Egyptian
Immigrants from Fiji
Vision Disability
Vision Disability Comparison
Egyptians
Immigrants from Fiji
1.9%
VISION DISABILITY
99.9/ 100
METRIC RATING
29th/ 347
METRIC RANK
2.2%
VISION DISABILITY
47.6/ 100
METRIC RATING
175th/ 347
METRIC RANK
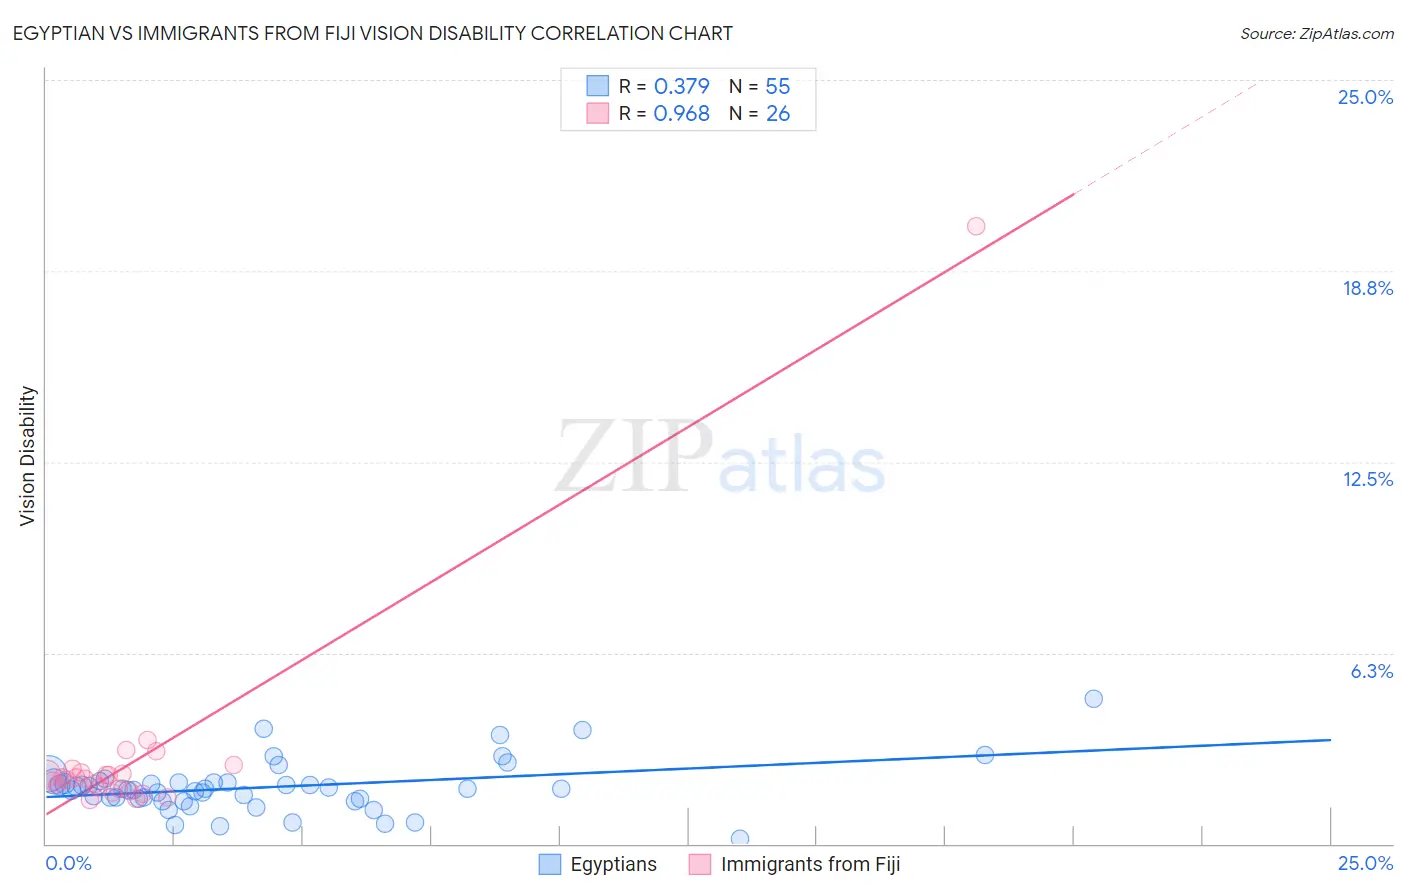
Egyptian vs Immigrants from Fiji Vision Disability Correlation Chart
The statistical analysis conducted on geographies consisting of 276,791,971 people shows a mild positive correlation between the proportion of Egyptians and percentage of population with vision disability in the United States with a correlation coefficient (R) of 0.379 and weighted average of 1.9%. Similarly, the statistical analysis conducted on geographies consisting of 93,750,153 people shows a perfect positive correlation between the proportion of Immigrants from Fiji and percentage of population with vision disability in the United States with a correlation coefficient (R) of 0.968 and weighted average of 2.2%, a difference of 12.4%.
Vision Disability Correlation Summary
| Measurement | Egyptian | Immigrants from Fiji |
| Minimum | 0.14% | 1.4% |
| Maximum | 4.7% | 20.2% |
| Range | 4.6% | 18.8% |
| Mean | 1.9% | 2.8% |
| Median | 1.8% | 2.1% |
| Interquartile 25% (IQ1) | 1.5% | 1.8% |
| Interquartile 75% (IQ3) | 2.0% | 2.4% |
| Interquartile Range (IQR) | 0.54% | 0.56% |
| Standard Deviation (Sample) | 0.83% | 3.6% |
| Standard Deviation (Population) | 0.82% | 3.5% |
Similar Demographics by Vision Disability
Demographics Similar to Egyptians by Vision Disability
In terms of vision disability, the demographic groups most similar to Egyptians are Immigrants from Nepal (1.9%, a difference of 0.040%), Immigrants from Malaysia (1.9%, a difference of 0.070%), Taiwanese (1.9%, a difference of 0.090%), Mongolian (1.9%, a difference of 0.20%), and Immigrants from Japan (1.9%, a difference of 0.43%).
| Demographics | Rating | Rank | Vision Disability |
| Immigrants | Pakistan | 100.0 /100 | #22 | Exceptional 1.9% |
| Immigrants | Asia | 99.9 /100 | #23 | Exceptional 1.9% |
| Immigrants | Lithuania | 99.9 /100 | #24 | Exceptional 1.9% |
| Bulgarians | 99.9 /100 | #25 | Exceptional 1.9% |
| Immigrants | Japan | 99.9 /100 | #26 | Exceptional 1.9% |
| Taiwanese | 99.9 /100 | #27 | Exceptional 1.9% |
| Immigrants | Malaysia | 99.9 /100 | #28 | Exceptional 1.9% |
| Egyptians | 99.9 /100 | #29 | Exceptional 1.9% |
| Immigrants | Nepal | 99.9 /100 | #30 | Exceptional 1.9% |
| Mongolians | 99.9 /100 | #31 | Exceptional 1.9% |
| Luxembourgers | 99.9 /100 | #32 | Exceptional 1.9% |
| Immigrants | Egypt | 99.9 /100 | #33 | Exceptional 1.9% |
| Immigrants | Turkey | 99.8 /100 | #34 | Exceptional 1.9% |
| Immigrants | Australia | 99.8 /100 | #35 | Exceptional 1.9% |
| Cambodians | 99.8 /100 | #36 | Exceptional 2.0% |
Demographics Similar to Immigrants from Fiji by Vision Disability
In terms of vision disability, the demographic groups most similar to Immigrants from Fiji are Yugoslavian (2.2%, a difference of 0.070%), Slavic (2.2%, a difference of 0.11%), Scandinavian (2.2%, a difference of 0.15%), Immigrants from Canada (2.2%, a difference of 0.15%), and Northern European (2.2%, a difference of 0.16%).
| Demographics | Rating | Rank | Vision Disability |
| Brazilians | 62.2 /100 | #168 | Good 2.1% |
| South American Indians | 57.4 /100 | #169 | Average 2.2% |
| Swiss | 55.7 /100 | #170 | Average 2.2% |
| Lebanese | 54.3 /100 | #171 | Average 2.2% |
| Northern Europeans | 50.1 /100 | #172 | Average 2.2% |
| Scandinavians | 50.0 /100 | #173 | Average 2.2% |
| Immigrants | Canada | 50.0 /100 | #174 | Average 2.2% |
| Immigrants | Fiji | 47.6 /100 | #175 | Average 2.2% |
| Yugoslavians | 46.5 /100 | #176 | Average 2.2% |
| Slavs | 46.0 /100 | #177 | Average 2.2% |
| Immigrants | Oceania | 45.1 /100 | #178 | Average 2.2% |
| Immigrants | North America | 44.5 /100 | #179 | Average 2.2% |
| Uruguayans | 42.7 /100 | #180 | Average 2.2% |
| Immigrants | Western Europe | 41.1 /100 | #181 | Average 2.2% |
| Costa Ricans | 40.7 /100 | #182 | Average 2.2% |