Egyptian vs Immigrants from Senegal Vision Disability
COMPARE
Egyptian
Immigrants from Senegal
Vision Disability
Vision Disability Comparison
Egyptians
Immigrants from Senegal
1.9%
VISION DISABILITY
99.9/ 100
METRIC RATING
29th/ 347
METRIC RANK
2.3%
VISION DISABILITY
3.8/ 100
METRIC RATING
222nd/ 347
METRIC RANK
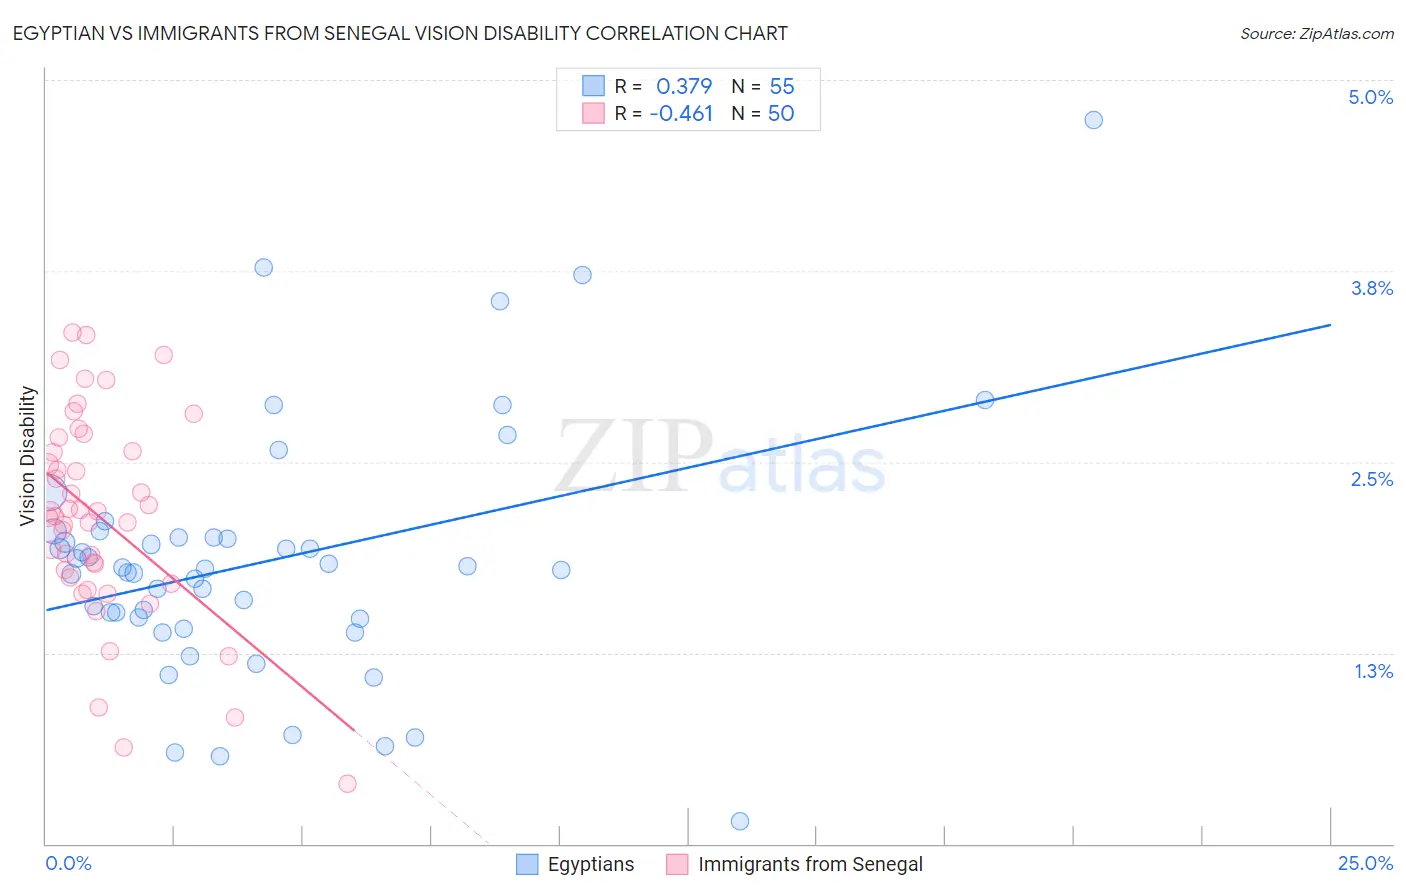
Egyptian vs Immigrants from Senegal Vision Disability Correlation Chart
The statistical analysis conducted on geographies consisting of 276,791,971 people shows a mild positive correlation between the proportion of Egyptians and percentage of population with vision disability in the United States with a correlation coefficient (R) of 0.379 and weighted average of 1.9%. Similarly, the statistical analysis conducted on geographies consisting of 90,101,349 people shows a moderate negative correlation between the proportion of Immigrants from Senegal and percentage of population with vision disability in the United States with a correlation coefficient (R) of -0.461 and weighted average of 2.3%, a difference of 18.0%.
Vision Disability Correlation Summary
| Measurement | Egyptian | Immigrants from Senegal |
| Minimum | 0.14% | 0.39% |
| Maximum | 4.7% | 3.3% |
| Range | 4.6% | 3.0% |
| Mean | 1.9% | 2.1% |
| Median | 1.8% | 2.2% |
| Interquartile 25% (IQ1) | 1.5% | 1.7% |
| Interquartile 75% (IQ3) | 2.0% | 2.6% |
| Interquartile Range (IQR) | 0.54% | 0.83% |
| Standard Deviation (Sample) | 0.83% | 0.68% |
| Standard Deviation (Population) | 0.82% | 0.67% |
Similar Demographics by Vision Disability
Demographics Similar to Egyptians by Vision Disability
In terms of vision disability, the demographic groups most similar to Egyptians are Immigrants from Nepal (1.9%, a difference of 0.040%), Immigrants from Malaysia (1.9%, a difference of 0.070%), Taiwanese (1.9%, a difference of 0.090%), Mongolian (1.9%, a difference of 0.20%), and Immigrants from Japan (1.9%, a difference of 0.43%).
| Demographics | Rating | Rank | Vision Disability |
| Immigrants | Pakistan | 100.0 /100 | #22 | Exceptional 1.9% |
| Immigrants | Asia | 99.9 /100 | #23 | Exceptional 1.9% |
| Immigrants | Lithuania | 99.9 /100 | #24 | Exceptional 1.9% |
| Bulgarians | 99.9 /100 | #25 | Exceptional 1.9% |
| Immigrants | Japan | 99.9 /100 | #26 | Exceptional 1.9% |
| Taiwanese | 99.9 /100 | #27 | Exceptional 1.9% |
| Immigrants | Malaysia | 99.9 /100 | #28 | Exceptional 1.9% |
| Egyptians | 99.9 /100 | #29 | Exceptional 1.9% |
| Immigrants | Nepal | 99.9 /100 | #30 | Exceptional 1.9% |
| Mongolians | 99.9 /100 | #31 | Exceptional 1.9% |
| Luxembourgers | 99.9 /100 | #32 | Exceptional 1.9% |
| Immigrants | Egypt | 99.9 /100 | #33 | Exceptional 1.9% |
| Immigrants | Turkey | 99.8 /100 | #34 | Exceptional 1.9% |
| Immigrants | Australia | 99.8 /100 | #35 | Exceptional 1.9% |
| Cambodians | 99.8 /100 | #36 | Exceptional 2.0% |
Demographics Similar to Immigrants from Senegal by Vision Disability
In terms of vision disability, the demographic groups most similar to Immigrants from Senegal are French Canadian (2.3%, a difference of 0.020%), Guamanian/Chamorro (2.3%, a difference of 0.040%), Basque (2.3%, a difference of 0.14%), Irish (2.3%, a difference of 0.17%), and Immigrants from Western Africa (2.3%, a difference of 0.18%).
| Demographics | Rating | Rank | Vision Disability |
| Nigerians | 7.2 /100 | #215 | Tragic 2.3% |
| Immigrants | Trinidad and Tobago | 6.1 /100 | #216 | Tragic 2.3% |
| Barbadians | 5.1 /100 | #217 | Tragic 2.3% |
| Portuguese | 4.9 /100 | #218 | Tragic 2.3% |
| Ecuadorians | 4.6 /100 | #219 | Tragic 2.3% |
| Guamanians/Chamorros | 3.9 /100 | #220 | Tragic 2.3% |
| French Canadians | 3.9 /100 | #221 | Tragic 2.3% |
| Immigrants | Senegal | 3.8 /100 | #222 | Tragic 2.3% |
| Basques | 3.5 /100 | #223 | Tragic 2.3% |
| Irish | 3.4 /100 | #224 | Tragic 2.3% |
| Immigrants | Western Africa | 3.4 /100 | #225 | Tragic 2.3% |
| Immigrants | Germany | 3.0 /100 | #226 | Tragic 2.3% |
| Hawaiians | 2.9 /100 | #227 | Tragic 2.3% |
| Hmong | 2.5 /100 | #228 | Tragic 2.3% |
| Welsh | 2.3 /100 | #229 | Tragic 2.3% |