Egyptian vs Immigrants from Fiji 9th Grade
COMPARE
Egyptian
Immigrants from Fiji
9th Grade
9th Grade Comparison
Egyptians
Immigrants from Fiji
95.0%
9TH GRADE
70.1/ 100
METRIC RATING
158th/ 347
METRIC RANK
92.3%
9TH GRADE
0.0/ 100
METRIC RATING
311th/ 347
METRIC RANK
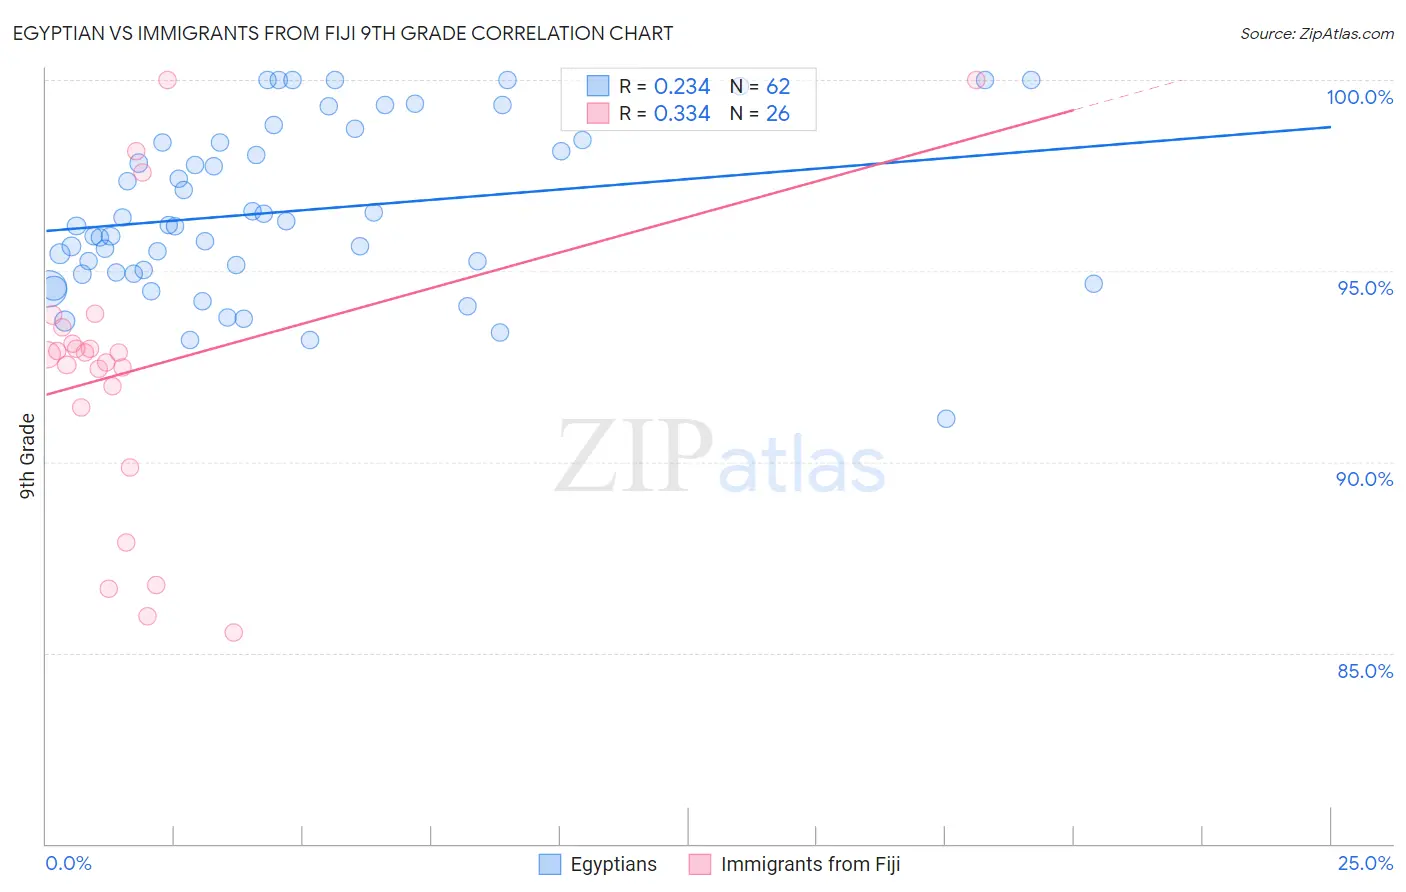
Egyptian vs Immigrants from Fiji 9th Grade Correlation Chart
The statistical analysis conducted on geographies consisting of 276,927,423 people shows a weak positive correlation between the proportion of Egyptians and percentage of population with at least 9th grade education in the United States with a correlation coefficient (R) of 0.234 and weighted average of 95.0%. Similarly, the statistical analysis conducted on geographies consisting of 93,756,204 people shows a mild positive correlation between the proportion of Immigrants from Fiji and percentage of population with at least 9th grade education in the United States with a correlation coefficient (R) of 0.334 and weighted average of 92.3%, a difference of 2.9%.
9th Grade Correlation Summary
| Measurement | Egyptian | Immigrants from Fiji |
| Minimum | 91.1% | 85.5% |
| Maximum | 100.0% | 100.0% |
| Range | 8.9% | 14.5% |
| Mean | 96.6% | 92.4% |
| Median | 96.2% | 92.8% |
| Interquartile 25% (IQ1) | 95.0% | 91.4% |
| Interquartile 75% (IQ3) | 98.4% | 93.5% |
| Interquartile Range (IQR) | 3.4% | 2.1% |
| Standard Deviation (Sample) | 2.2% | 3.8% |
| Standard Deviation (Population) | 2.2% | 3.7% |
Similar Demographics by 9th Grade
Demographics Similar to Egyptians by 9th Grade
In terms of 9th grade, the demographic groups most similar to Egyptians are Immigrants from Ukraine (95.0%, a difference of 0.020%), Immigrants from Kenya (95.0%, a difference of 0.030%), Mongolian (95.0%, a difference of 0.030%), Immigrants from Italy (95.0%, a difference of 0.030%), and French American Indian (95.0%, a difference of 0.030%).
| Demographics | Rating | Rank | 9th Grade |
| Cajuns | 77.3 /100 | #151 | Good 95.1% |
| Ugandans | 77.0 /100 | #152 | Good 95.1% |
| Albanians | 76.1 /100 | #153 | Good 95.1% |
| Arabs | 74.9 /100 | #154 | Good 95.1% |
| Immigrants | Kazakhstan | 74.7 /100 | #155 | Good 95.1% |
| Immigrants | Kenya | 73.1 /100 | #156 | Good 95.0% |
| Mongolians | 73.0 /100 | #157 | Good 95.0% |
| Egyptians | 70.1 /100 | #158 | Good 95.0% |
| Immigrants | Ukraine | 67.4 /100 | #159 | Good 95.0% |
| Immigrants | Italy | 66.6 /100 | #160 | Good 95.0% |
| French American Indians | 66.5 /100 | #161 | Good 95.0% |
| Bermudans | 65.8 /100 | #162 | Good 95.0% |
| Pakistanis | 64.1 /100 | #163 | Good 95.0% |
| Venezuelans | 63.6 /100 | #164 | Good 95.0% |
| Blackfeet | 62.6 /100 | #165 | Good 95.0% |
Demographics Similar to Immigrants from Fiji by 9th Grade
In terms of 9th grade, the demographic groups most similar to Immigrants from Fiji are Immigrants from Cambodia (92.4%, a difference of 0.030%), Houma (92.3%, a difference of 0.030%), Immigrants from Bangladesh (92.4%, a difference of 0.050%), Vietnamese (92.3%, a difference of 0.050%), and Immigrants from Portugal (92.2%, a difference of 0.090%).
| Demographics | Rating | Rank | 9th Grade |
| Tohono O'odham | 0.0 /100 | #304 | Tragic 92.6% |
| Japanese | 0.0 /100 | #305 | Tragic 92.6% |
| Immigrants | Vietnam | 0.0 /100 | #306 | Tragic 92.6% |
| Immigrants | Immigrants | 0.0 /100 | #307 | Tragic 92.5% |
| Immigrants | Guyana | 0.0 /100 | #308 | Tragic 92.5% |
| Immigrants | Bangladesh | 0.0 /100 | #309 | Tragic 92.4% |
| Immigrants | Cambodia | 0.0 /100 | #310 | Tragic 92.4% |
| Immigrants | Fiji | 0.0 /100 | #311 | Tragic 92.3% |
| Houma | 0.0 /100 | #312 | Tragic 92.3% |
| Vietnamese | 0.0 /100 | #313 | Tragic 92.3% |
| Immigrants | Portugal | 0.0 /100 | #314 | Tragic 92.2% |
| Immigrants | Caribbean | 0.0 /100 | #315 | Tragic 92.2% |
| Cape Verdeans | 0.0 /100 | #316 | Tragic 92.2% |
| Immigrants | Cuba | 0.0 /100 | #317 | Tragic 92.2% |
| Nepalese | 0.0 /100 | #318 | Tragic 92.0% |