Egyptian vs Immigrants from Fiji In Labor Force | Age 20-24
COMPARE
Egyptian
Immigrants from Fiji
In Labor Force | Age 20-24
In Labor Force | Age 20-24 Comparison
Egyptians
Immigrants from Fiji
73.7%
IN LABOR FORCE | AGE 20-24
0.7/ 100
METRIC RATING
258th/ 347
METRIC RANK
74.3%
IN LABOR FORCE | AGE 20-24
5.9/ 100
METRIC RATING
226th/ 347
METRIC RANK
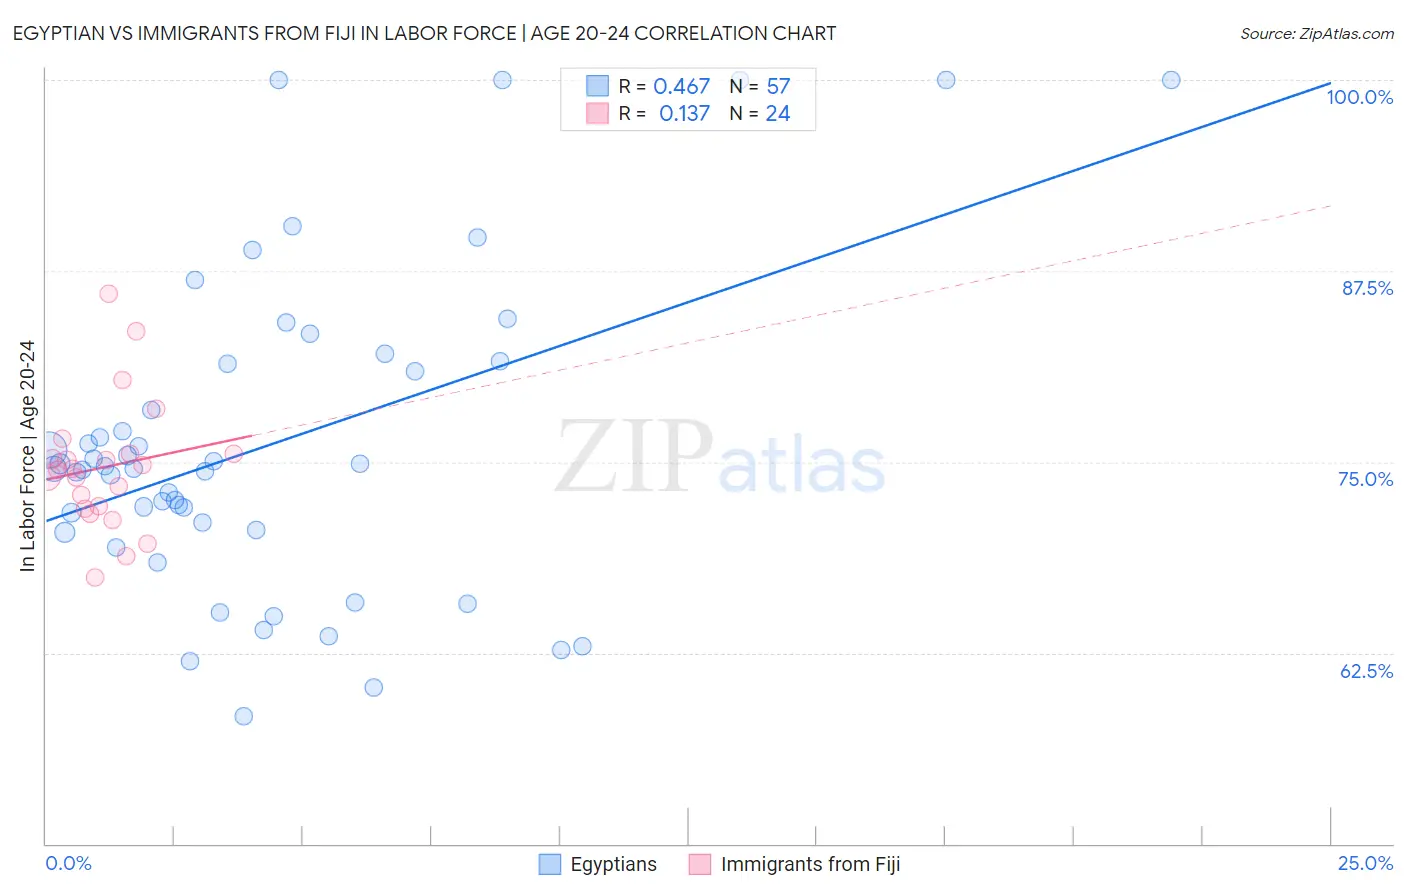
Egyptian vs Immigrants from Fiji In Labor Force | Age 20-24 Correlation Chart
The statistical analysis conducted on geographies consisting of 276,889,106 people shows a moderate positive correlation between the proportion of Egyptians and labor force participation rate among population between the ages 20 and 24 in the United States with a correlation coefficient (R) of 0.467 and weighted average of 73.7%. Similarly, the statistical analysis conducted on geographies consisting of 93,752,129 people shows a poor positive correlation between the proportion of Immigrants from Fiji and labor force participation rate among population between the ages 20 and 24 in the United States with a correlation coefficient (R) of 0.137 and weighted average of 74.3%, a difference of 0.81%.
In Labor Force | Age 20-24 Correlation Summary
| Measurement | Egyptian | Immigrants from Fiji |
| Minimum | 58.3% | 67.4% |
| Maximum | 100.0% | 86.0% |
| Range | 41.7% | 18.6% |
| Mean | 76.2% | 74.7% |
| Median | 74.6% | 74.5% |
| Interquartile 25% (IQ1) | 70.5% | 72.0% |
| Interquartile 75% (IQ3) | 81.5% | 75.5% |
| Interquartile Range (IQR) | 11.0% | 3.5% |
| Standard Deviation (Sample) | 10.4% | 4.2% |
| Standard Deviation (Population) | 10.3% | 4.2% |
Similar Demographics by In Labor Force | Age 20-24
Demographics Similar to Egyptians by In Labor Force | Age 20-24
In terms of in labor force | age 20-24, the demographic groups most similar to Egyptians are Dutch West Indian (73.7%, a difference of 0.0%), Immigrants from Turkey (73.7%, a difference of 0.030%), Paraguayan (73.7%, a difference of 0.040%), Houma (73.7%, a difference of 0.040%), and Asian (73.7%, a difference of 0.050%).
| Demographics | Rating | Rank | In Labor Force | Age 20-24 |
| Immigrants | Egypt | 1.2 /100 | #251 | Tragic 73.8% |
| Immigrants | Kazakhstan | 1.1 /100 | #252 | Tragic 73.8% |
| Arapaho | 1.0 /100 | #253 | Tragic 73.8% |
| Ute | 1.0 /100 | #254 | Tragic 73.8% |
| Immigrants | Pakistan | 0.9 /100 | #255 | Tragic 73.8% |
| Spanish American Indians | 0.8 /100 | #256 | Tragic 73.7% |
| Paraguayans | 0.8 /100 | #257 | Tragic 73.7% |
| Egyptians | 0.7 /100 | #258 | Tragic 73.7% |
| Dutch West Indians | 0.7 /100 | #259 | Tragic 73.7% |
| Immigrants | Turkey | 0.7 /100 | #260 | Tragic 73.7% |
| Houma | 0.6 /100 | #261 | Tragic 73.7% |
| Asians | 0.6 /100 | #262 | Tragic 73.7% |
| Immigrants | Asia | 0.5 /100 | #263 | Tragic 73.6% |
| Immigrants | Haiti | 0.5 /100 | #264 | Tragic 73.6% |
| Burmese | 0.5 /100 | #265 | Tragic 73.6% |
Demographics Similar to Immigrants from Fiji by In Labor Force | Age 20-24
In terms of in labor force | age 20-24, the demographic groups most similar to Immigrants from Fiji are Immigrants from Ireland (74.3%, a difference of 0.010%), Ghanaian (74.3%, a difference of 0.020%), Seminole (74.3%, a difference of 0.060%), Immigrants from Ukraine (74.2%, a difference of 0.060%), and Immigrants from Sweden (74.2%, a difference of 0.090%).
| Demographics | Rating | Rank | In Labor Force | Age 20-24 |
| Nepalese | 10.5 /100 | #219 | Poor 74.5% |
| Immigrants | Norway | 10.3 /100 | #220 | Poor 74.5% |
| Chickasaw | 10.3 /100 | #221 | Poor 74.5% |
| Immigrants | India | 9.9 /100 | #222 | Tragic 74.4% |
| Hispanics or Latinos | 7.9 /100 | #223 | Tragic 74.4% |
| Seminole | 6.9 /100 | #224 | Tragic 74.3% |
| Ghanaians | 6.2 /100 | #225 | Tragic 74.3% |
| Immigrants | Fiji | 5.9 /100 | #226 | Tragic 74.3% |
| Immigrants | Ireland | 5.8 /100 | #227 | Tragic 74.3% |
| Immigrants | Ukraine | 5.1 /100 | #228 | Tragic 74.2% |
| Immigrants | Sweden | 4.6 /100 | #229 | Tragic 74.2% |
| Immigrants | Albania | 4.3 /100 | #230 | Tragic 74.2% |
| Immigrants | Greece | 4.1 /100 | #231 | Tragic 74.2% |
| Immigrants | Switzerland | 4.1 /100 | #232 | Tragic 74.2% |
| Immigrants | Chile | 3.7 /100 | #233 | Tragic 74.1% |