Chilean vs Immigrants from Fiji Vision Disability
COMPARE
Chilean
Immigrants from Fiji
Vision Disability
Vision Disability Comparison
Chileans
Immigrants from Fiji
2.1%
VISION DISABILITY
94.0/ 100
METRIC RATING
109th/ 347
METRIC RANK
2.2%
VISION DISABILITY
47.6/ 100
METRIC RATING
175th/ 347
METRIC RANK
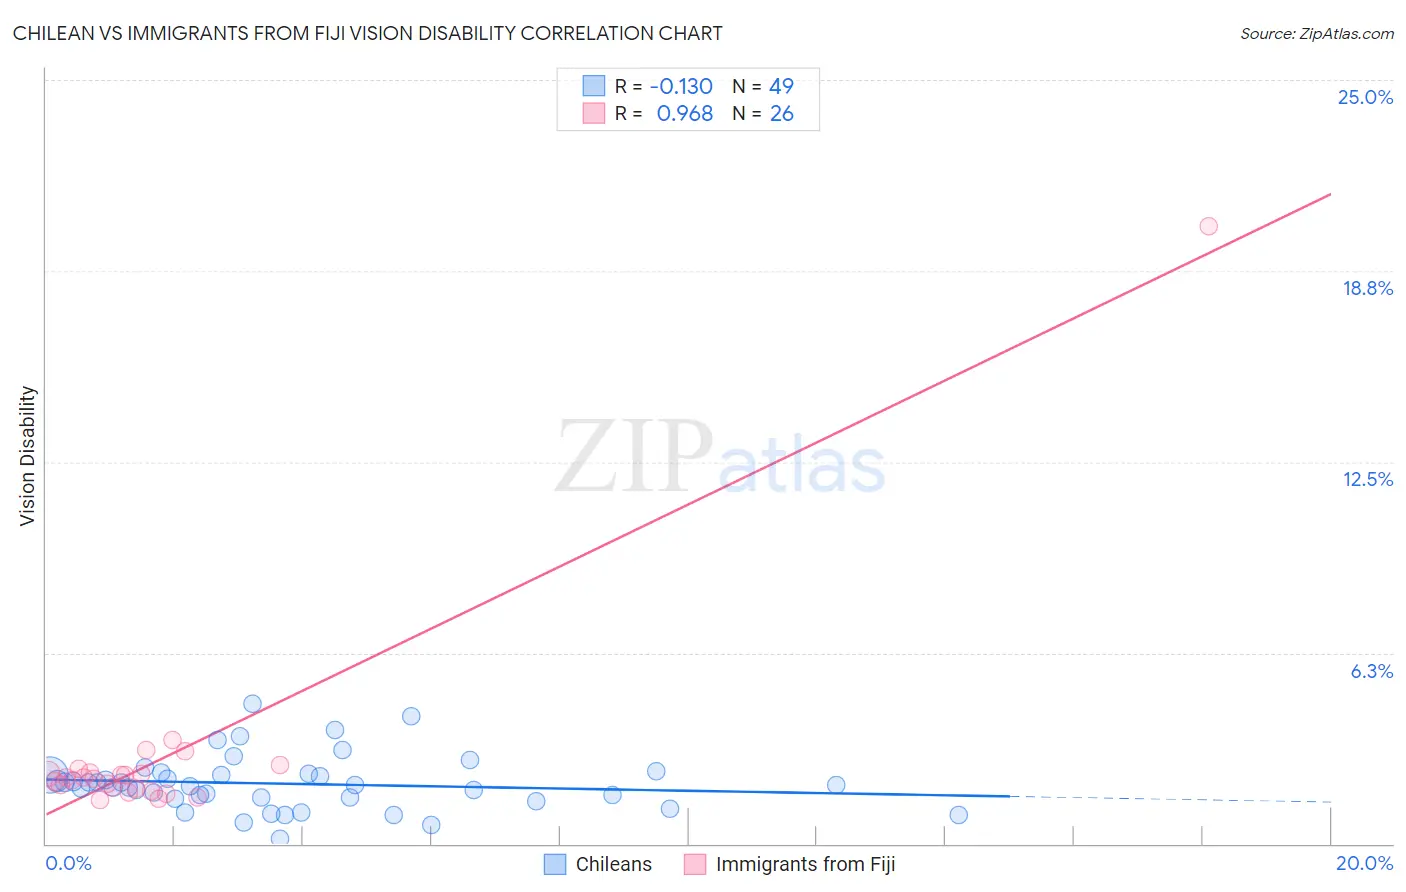
Chilean vs Immigrants from Fiji Vision Disability Correlation Chart
The statistical analysis conducted on geographies consisting of 256,590,640 people shows a poor negative correlation between the proportion of Chileans and percentage of population with vision disability in the United States with a correlation coefficient (R) of -0.130 and weighted average of 2.1%. Similarly, the statistical analysis conducted on geographies consisting of 93,750,153 people shows a perfect positive correlation between the proportion of Immigrants from Fiji and percentage of population with vision disability in the United States with a correlation coefficient (R) of 0.968 and weighted average of 2.2%, a difference of 4.7%.
Vision Disability Correlation Summary
| Measurement | Chilean | Immigrants from Fiji |
| Minimum | 0.17% | 1.4% |
| Maximum | 4.6% | 20.2% |
| Range | 4.4% | 18.8% |
| Mean | 2.0% | 2.8% |
| Median | 1.9% | 2.1% |
| Interquartile 25% (IQ1) | 1.5% | 1.8% |
| Interquartile 75% (IQ3) | 2.3% | 2.4% |
| Interquartile Range (IQR) | 0.79% | 0.56% |
| Standard Deviation (Sample) | 0.89% | 3.6% |
| Standard Deviation (Population) | 0.88% | 3.5% |
Similar Demographics by Vision Disability
Demographics Similar to Chileans by Vision Disability
In terms of vision disability, the demographic groups most similar to Chileans are Korean (2.1%, a difference of 0.020%), Swedish (2.1%, a difference of 0.050%), Danish (2.1%, a difference of 0.050%), Immigrants from Armenia (2.1%, a difference of 0.070%), and Carpatho Rusyn (2.1%, a difference of 0.10%).
| Demographics | Rating | Rank | Vision Disability |
| Sri Lankans | 94.8 /100 | #102 | Exceptional 2.1% |
| Immigrants | Austria | 94.4 /100 | #103 | Exceptional 2.1% |
| Immigrants | Italy | 94.4 /100 | #104 | Exceptional 2.1% |
| Carpatho Rusyns | 94.3 /100 | #105 | Exceptional 2.1% |
| Swedes | 94.2 /100 | #106 | Exceptional 2.1% |
| Danes | 94.2 /100 | #107 | Exceptional 2.1% |
| Koreans | 94.1 /100 | #108 | Exceptional 2.1% |
| Chileans | 94.0 /100 | #109 | Exceptional 2.1% |
| Immigrants | Armenia | 93.8 /100 | #110 | Exceptional 2.1% |
| Peruvians | 93.5 /100 | #111 | Exceptional 2.1% |
| Immigrants | Denmark | 92.9 /100 | #112 | Exceptional 2.1% |
| Kenyans | 92.5 /100 | #113 | Exceptional 2.1% |
| Croatians | 92.3 /100 | #114 | Exceptional 2.1% |
| Immigrants | Vietnam | 92.2 /100 | #115 | Exceptional 2.1% |
| Ugandans | 92.2 /100 | #116 | Exceptional 2.1% |
Demographics Similar to Immigrants from Fiji by Vision Disability
In terms of vision disability, the demographic groups most similar to Immigrants from Fiji are Yugoslavian (2.2%, a difference of 0.070%), Slavic (2.2%, a difference of 0.11%), Scandinavian (2.2%, a difference of 0.15%), Immigrants from Canada (2.2%, a difference of 0.15%), and Northern European (2.2%, a difference of 0.16%).
| Demographics | Rating | Rank | Vision Disability |
| Brazilians | 62.2 /100 | #168 | Good 2.1% |
| South American Indians | 57.4 /100 | #169 | Average 2.2% |
| Swiss | 55.7 /100 | #170 | Average 2.2% |
| Lebanese | 54.3 /100 | #171 | Average 2.2% |
| Northern Europeans | 50.1 /100 | #172 | Average 2.2% |
| Scandinavians | 50.0 /100 | #173 | Average 2.2% |
| Immigrants | Canada | 50.0 /100 | #174 | Average 2.2% |
| Immigrants | Fiji | 47.6 /100 | #175 | Average 2.2% |
| Yugoslavians | 46.5 /100 | #176 | Average 2.2% |
| Slavs | 46.0 /100 | #177 | Average 2.2% |
| Immigrants | Oceania | 45.1 /100 | #178 | Average 2.2% |
| Immigrants | North America | 44.5 /100 | #179 | Average 2.2% |
| Uruguayans | 42.7 /100 | #180 | Average 2.2% |
| Immigrants | Western Europe | 41.1 /100 | #181 | Average 2.2% |
| Costa Ricans | 40.7 /100 | #182 | Average 2.2% |