Eastern European vs Native Hawaiian Disability Age Under 5
COMPARE
Eastern European
Native Hawaiian
Disability Age Under 5
Disability Age Under 5 Comparison
Eastern Europeans
Native Hawaiians
1.4%
DISABILITY AGE UNDER 5
1.0/ 100
METRIC RATING
248th/ 347
METRIC RANK
1.3%
DISABILITY AGE UNDER 5
2.2/ 100
METRIC RATING
240th/ 347
METRIC RANK
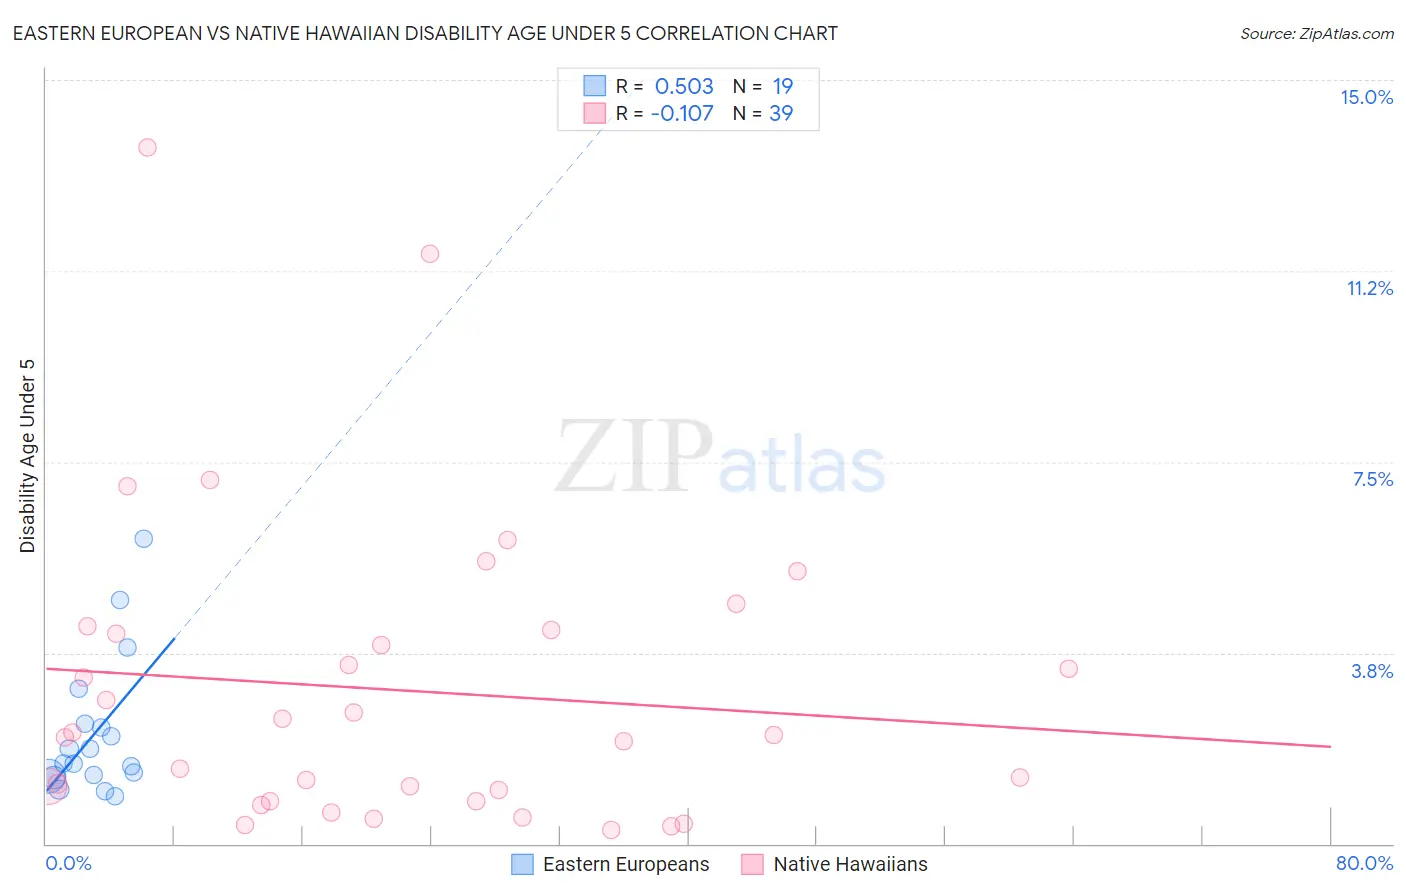
Eastern European vs Native Hawaiian Disability Age Under 5 Correlation Chart
The statistical analysis conducted on geographies consisting of 231,188,302 people shows a substantial positive correlation between the proportion of Eastern Europeans and percentage of population with a disability under the age of 5 in the United States with a correlation coefficient (R) of 0.503 and weighted average of 1.4%. Similarly, the statistical analysis conducted on geographies consisting of 196,669,282 people shows a poor negative correlation between the proportion of Native Hawaiians and percentage of population with a disability under the age of 5 in the United States with a correlation coefficient (R) of -0.107 and weighted average of 1.3%, a difference of 1.7%.
Disability Age Under 5 Correlation Summary
| Measurement | Eastern European | Native Hawaiian |
| Minimum | 0.93% | 0.27% |
| Maximum | 6.0% | 13.7% |
| Range | 5.1% | 13.4% |
| Mean | 2.2% | 3.0% |
| Median | 1.6% | 2.1% |
| Interquartile 25% (IQ1) | 1.3% | 0.83% |
| Interquartile 75% (IQ3) | 2.4% | 4.2% |
| Interquartile Range (IQR) | 1.0% | 3.4% |
| Standard Deviation (Sample) | 1.4% | 3.0% |
| Standard Deviation (Population) | 1.3% | 2.9% |
Demographics Similar to Eastern Europeans and Native Hawaiians by Disability Age Under 5
In terms of disability age under 5, the demographic groups most similar to Eastern Europeans are Immigrants from England (1.4%, a difference of 0.030%), Russian (1.4%, a difference of 0.050%), Bermudan (1.4%, a difference of 0.080%), African (1.4%, a difference of 0.090%), and Immigrants from Hungary (1.4%, a difference of 0.12%). Similarly, the demographic groups most similar to Native Hawaiians are Immigrants from Austria (1.3%, a difference of 0.020%), Maltese (1.3%, a difference of 0.070%), Lumbee (1.3%, a difference of 0.15%), Spanish American Indian (1.3%, a difference of 0.18%), and Immigrants from Cameroon (1.4%, a difference of 0.53%).
| Demographics | Rating | Rank | Disability Age Under 5 |
| Pueblo | 3.8 /100 | #234 | Tragic 1.3% |
| Central American Indians | 3.6 /100 | #235 | Tragic 1.3% |
| South American Indians | 3.3 /100 | #236 | Tragic 1.3% |
| Basques | 3.0 /100 | #237 | Tragic 1.3% |
| Spanish American Indians | 2.4 /100 | #238 | Tragic 1.3% |
| Immigrants | Austria | 2.3 /100 | #239 | Tragic 1.3% |
| Native Hawaiians | 2.2 /100 | #240 | Tragic 1.3% |
| Maltese | 2.2 /100 | #241 | Tragic 1.3% |
| Lumbee | 2.1 /100 | #242 | Tragic 1.3% |
| Immigrants | Cameroon | 1.7 /100 | #243 | Tragic 1.4% |
| Spaniards | 1.4 /100 | #244 | Tragic 1.4% |
| Potawatomi | 1.1 /100 | #245 | Tragic 1.4% |
| Russians | 1.0 /100 | #246 | Tragic 1.4% |
| Immigrants | England | 1.0 /100 | #247 | Tragic 1.4% |
| Eastern Europeans | 1.0 /100 | #248 | Tragic 1.4% |
| Bermudans | 1.0 /100 | #249 | Tragic 1.4% |
| Africans | 1.0 /100 | #250 | Tragic 1.4% |
| Immigrants | Hungary | 1.0 /100 | #251 | Tragic 1.4% |
| Immigrants | Scotland | 0.9 /100 | #252 | Tragic 1.4% |
| Australians | 0.7 /100 | #253 | Tragic 1.4% |
| Immigrants | Brazil | 0.7 /100 | #254 | Tragic 1.4% |