Dutch West Indian vs Yup'ik Ambulatory Disability
COMPARE
Dutch West Indian
Yup'ik
Ambulatory Disability
Ambulatory Disability Comparison
Dutch West Indians
Yup'ik
8.2%
AMBULATORY DISABILITY
0.0/ 100
METRIC RATING
337th/ 347
METRIC RANK
5.2%
AMBULATORY DISABILITY
100.0/ 100
METRIC RATING
10th/ 347
METRIC RANK
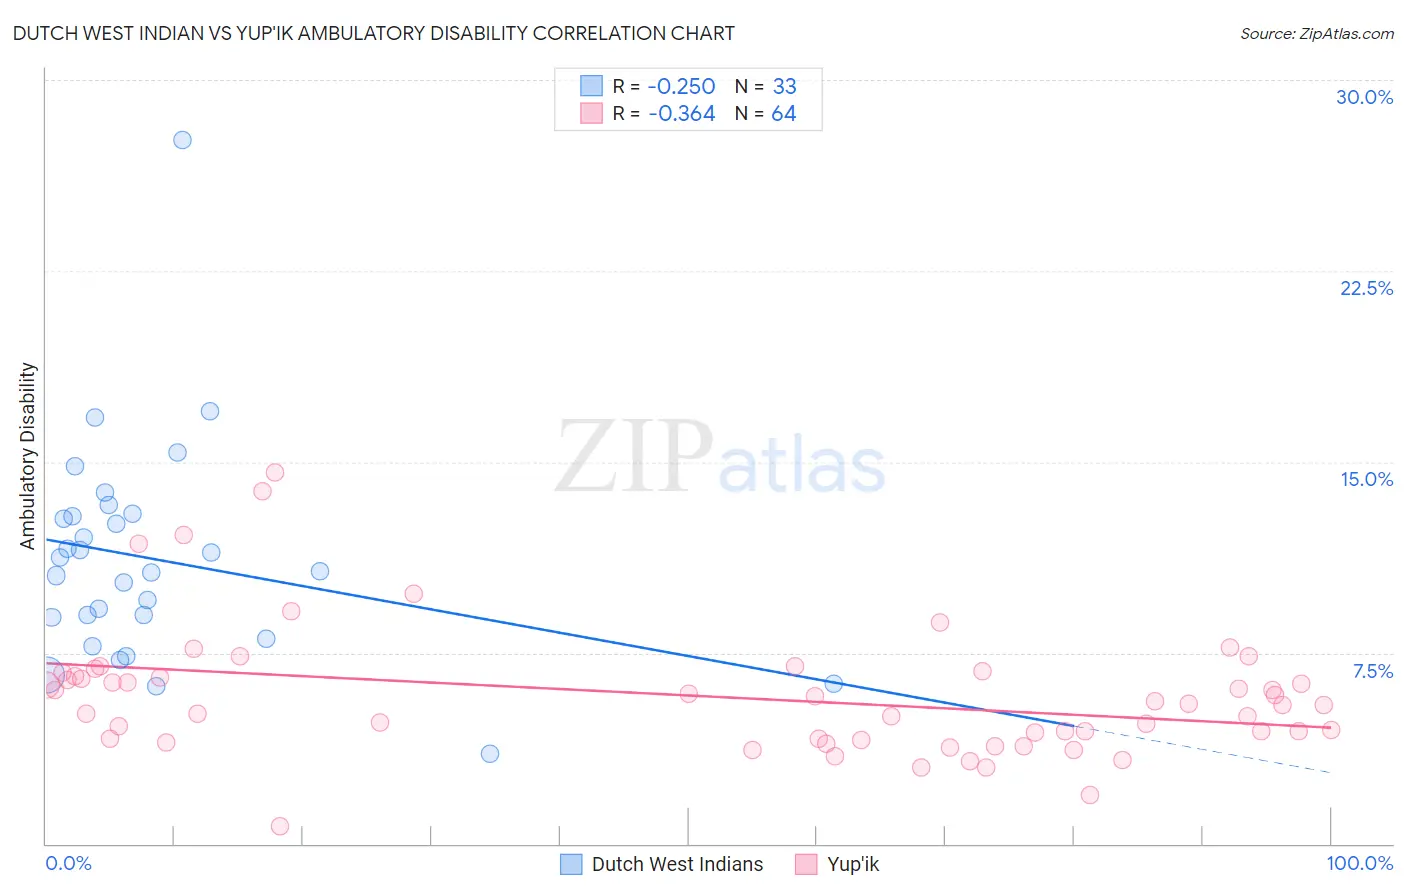
Dutch West Indian vs Yup'ik Ambulatory Disability Correlation Chart
The statistical analysis conducted on geographies consisting of 85,765,361 people shows a weak negative correlation between the proportion of Dutch West Indians and percentage of population with ambulatory disability in the United States with a correlation coefficient (R) of -0.250 and weighted average of 8.2%. Similarly, the statistical analysis conducted on geographies consisting of 39,959,471 people shows a mild negative correlation between the proportion of Yup'ik and percentage of population with ambulatory disability in the United States with a correlation coefficient (R) of -0.364 and weighted average of 5.2%, a difference of 58.4%.
Ambulatory Disability Correlation Summary
| Measurement | Dutch West Indian | Yup'ik |
| Minimum | 3.6% | 0.68% |
| Maximum | 27.7% | 14.6% |
| Range | 24.1% | 13.9% |
| Mean | 11.2% | 5.8% |
| Median | 10.7% | 5.5% |
| Interquartile 25% (IQ1) | 8.5% | 4.1% |
| Interquartile 75% (IQ3) | 12.9% | 6.6% |
| Interquartile Range (IQR) | 4.4% | 2.5% |
| Standard Deviation (Sample) | 4.3% | 2.5% |
| Standard Deviation (Population) | 4.2% | 2.5% |
Similar Demographics by Ambulatory Disability
Demographics Similar to Dutch West Indians by Ambulatory Disability
In terms of ambulatory disability, the demographic groups most similar to Dutch West Indians are Colville (8.2%, a difference of 0.57%), Pima (8.2%, a difference of 0.92%), Seminole (8.0%, a difference of 1.6%), Chickasaw (8.0%, a difference of 1.7%), and Choctaw (8.3%, a difference of 1.8%).
| Demographics | Rating | Rank | Ambulatory Disability |
| Paiute | 0.0 /100 | #330 | Tragic 7.7% |
| Cajuns | 0.0 /100 | #331 | Tragic 7.8% |
| Menominee | 0.0 /100 | #332 | Tragic 7.8% |
| Cherokee | 0.0 /100 | #333 | Tragic 7.9% |
| Yuman | 0.0 /100 | #334 | Tragic 7.9% |
| Chickasaw | 0.0 /100 | #335 | Tragic 8.0% |
| Seminole | 0.0 /100 | #336 | Tragic 8.0% |
| Dutch West Indians | 0.0 /100 | #337 | Tragic 8.2% |
| Colville | 0.0 /100 | #338 | Tragic 8.2% |
| Pima | 0.0 /100 | #339 | Tragic 8.2% |
| Choctaw | 0.0 /100 | #340 | Tragic 8.3% |
| Creek | 0.0 /100 | #341 | Tragic 8.5% |
| Kiowa | 0.0 /100 | #342 | Tragic 8.6% |
| Tohono O'odham | 0.0 /100 | #343 | Tragic 8.7% |
| Tsimshian | 0.0 /100 | #344 | Tragic 8.8% |
Demographics Similar to Yup'ik by Ambulatory Disability
In terms of ambulatory disability, the demographic groups most similar to Yup'ik are Iranian (5.1%, a difference of 0.60%), Immigrants from South Central Asia (5.1%, a difference of 0.97%), Immigrants from Korea (5.2%, a difference of 1.6%), Okinawan (5.3%, a difference of 1.9%), and Bolivian (5.1%, a difference of 2.0%).
| Demographics | Rating | Rank | Ambulatory Disability |
| Thais | 100.0 /100 | #3 | Exceptional 4.9% |
| Immigrants | Taiwan | 100.0 /100 | #4 | Exceptional 4.9% |
| Immigrants | Singapore | 100.0 /100 | #5 | Exceptional 5.0% |
| Immigrants | Bolivia | 100.0 /100 | #6 | Exceptional 5.0% |
| Bolivians | 100.0 /100 | #7 | Exceptional 5.1% |
| Immigrants | South Central Asia | 100.0 /100 | #8 | Exceptional 5.1% |
| Iranians | 100.0 /100 | #9 | Exceptional 5.1% |
| Yup'ik | 100.0 /100 | #10 | Exceptional 5.2% |
| Immigrants | Korea | 100.0 /100 | #11 | Exceptional 5.2% |
| Okinawans | 100.0 /100 | #12 | Exceptional 5.3% |
| Burmese | 100.0 /100 | #13 | Exceptional 5.3% |
| Immigrants | Eastern Asia | 100.0 /100 | #14 | Exceptional 5.3% |
| Immigrants | China | 100.0 /100 | #15 | Exceptional 5.3% |
| Immigrants | Hong Kong | 100.0 /100 | #16 | Exceptional 5.3% |
| Immigrants | Ethiopia | 100.0 /100 | #17 | Exceptional 5.4% |