Puget Sound Salish vs Yup'ik Ambulatory Disability
COMPARE
Puget Sound Salish
Yup'ik
Ambulatory Disability
Ambulatory Disability Comparison
Puget Sound Salish
Yup'ik
6.9%
AMBULATORY DISABILITY
0.0/ 100
METRIC RATING
299th/ 347
METRIC RANK
5.2%
AMBULATORY DISABILITY
100.0/ 100
METRIC RATING
10th/ 347
METRIC RANK
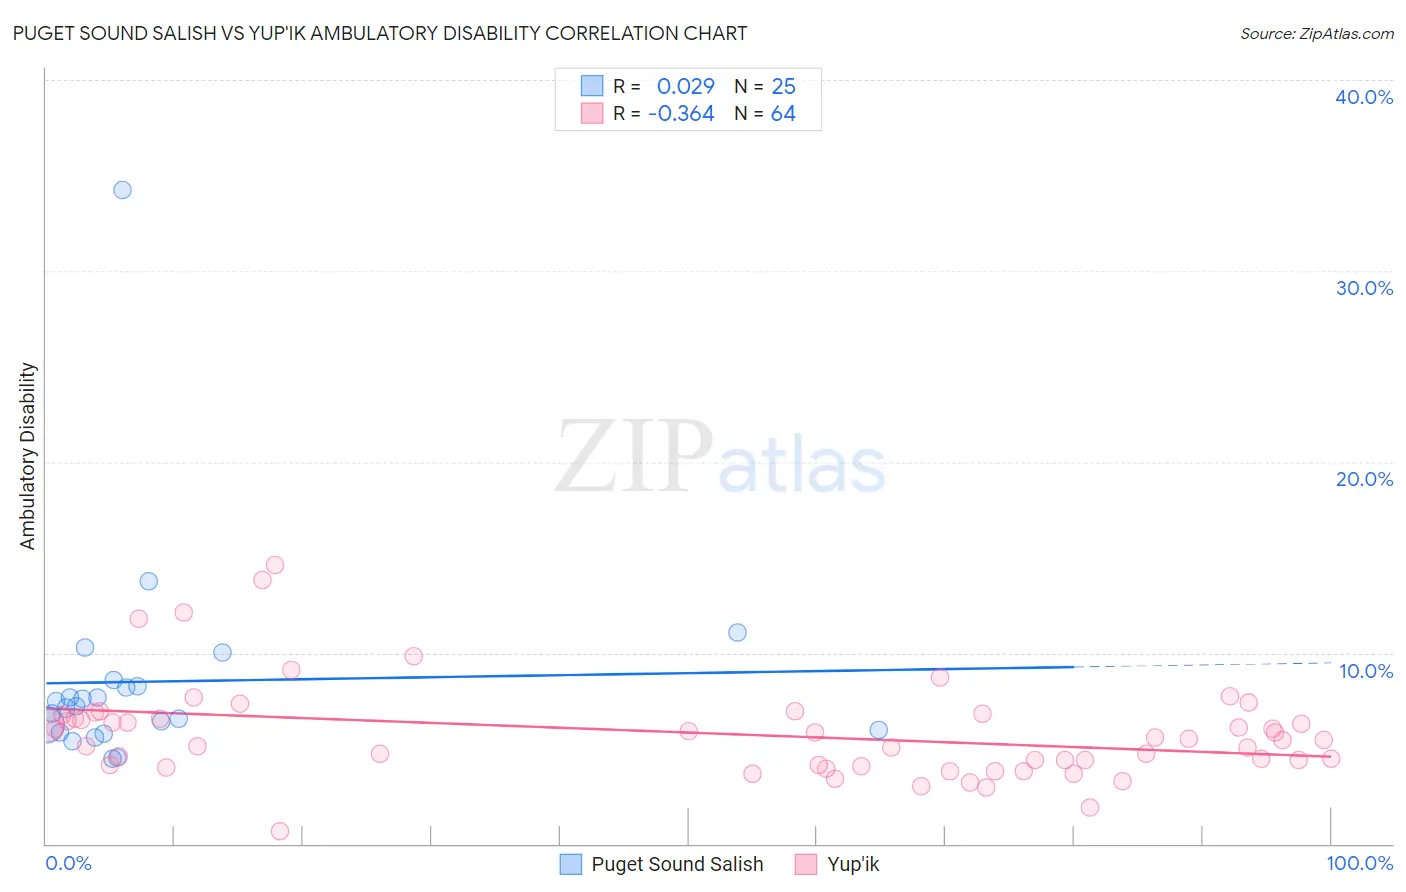
Puget Sound Salish vs Yup'ik Ambulatory Disability Correlation Chart
The statistical analysis conducted on geographies consisting of 46,152,398 people shows no correlation between the proportion of Puget Sound Salish and percentage of population with ambulatory disability in the United States with a correlation coefficient (R) of 0.029 and weighted average of 6.9%. Similarly, the statistical analysis conducted on geographies consisting of 39,959,471 people shows a mild negative correlation between the proportion of Yup'ik and percentage of population with ambulatory disability in the United States with a correlation coefficient (R) of -0.364 and weighted average of 5.2%, a difference of 34.7%.
Ambulatory Disability Correlation Summary
| Measurement | Puget Sound Salish | Yup'ik |
| Minimum | 4.5% | 0.68% |
| Maximum | 34.2% | 14.6% |
| Range | 29.7% | 13.9% |
| Mean | 8.5% | 5.8% |
| Median | 7.2% | 5.5% |
| Interquartile 25% (IQ1) | 5.9% | 4.1% |
| Interquartile 75% (IQ3) | 8.4% | 6.6% |
| Interquartile Range (IQR) | 2.5% | 2.5% |
| Standard Deviation (Sample) | 5.8% | 2.5% |
| Standard Deviation (Population) | 5.6% | 2.5% |
Similar Demographics by Ambulatory Disability
Demographics Similar to Puget Sound Salish by Ambulatory Disability
In terms of ambulatory disability, the demographic groups most similar to Puget Sound Salish are Marshallese (6.9%, a difference of 0.010%), Immigrants from Grenada (6.9%, a difference of 0.13%), French American Indian (6.9%, a difference of 0.14%), British West Indian (7.0%, a difference of 0.24%), and Immigrants from Armenia (7.0%, a difference of 0.30%).
| Demographics | Rating | Rank | Ambulatory Disability |
| Cheyenne | 0.0 /100 | #292 | Tragic 6.9% |
| Immigrants | St. Vincent and the Grenadines | 0.0 /100 | #293 | Tragic 6.9% |
| Cape Verdeans | 0.0 /100 | #294 | Tragic 6.9% |
| Crow | 0.0 /100 | #295 | Tragic 6.9% |
| Alaskan Athabascans | 0.0 /100 | #296 | Tragic 6.9% |
| French American Indians | 0.0 /100 | #297 | Tragic 6.9% |
| Immigrants | Grenada | 0.0 /100 | #298 | Tragic 6.9% |
| Puget Sound Salish | 0.0 /100 | #299 | Tragic 6.9% |
| Marshallese | 0.0 /100 | #300 | Tragic 6.9% |
| British West Indians | 0.0 /100 | #301 | Tragic 7.0% |
| Immigrants | Armenia | 0.0 /100 | #302 | Tragic 7.0% |
| Africans | 0.0 /100 | #303 | Tragic 7.0% |
| Immigrants | Cabo Verde | 0.0 /100 | #304 | Tragic 7.0% |
| Immigrants | Micronesia | 0.0 /100 | #305 | Tragic 7.0% |
| Iroquois | 0.0 /100 | #306 | Tragic 7.1% |
Demographics Similar to Yup'ik by Ambulatory Disability
In terms of ambulatory disability, the demographic groups most similar to Yup'ik are Iranian (5.1%, a difference of 0.60%), Immigrants from South Central Asia (5.1%, a difference of 0.97%), Immigrants from Korea (5.2%, a difference of 1.6%), Okinawan (5.3%, a difference of 1.9%), and Bolivian (5.1%, a difference of 2.0%).
| Demographics | Rating | Rank | Ambulatory Disability |
| Thais | 100.0 /100 | #3 | Exceptional 4.9% |
| Immigrants | Taiwan | 100.0 /100 | #4 | Exceptional 4.9% |
| Immigrants | Singapore | 100.0 /100 | #5 | Exceptional 5.0% |
| Immigrants | Bolivia | 100.0 /100 | #6 | Exceptional 5.0% |
| Bolivians | 100.0 /100 | #7 | Exceptional 5.1% |
| Immigrants | South Central Asia | 100.0 /100 | #8 | Exceptional 5.1% |
| Iranians | 100.0 /100 | #9 | Exceptional 5.1% |
| Yup'ik | 100.0 /100 | #10 | Exceptional 5.2% |
| Immigrants | Korea | 100.0 /100 | #11 | Exceptional 5.2% |
| Okinawans | 100.0 /100 | #12 | Exceptional 5.3% |
| Burmese | 100.0 /100 | #13 | Exceptional 5.3% |
| Immigrants | Eastern Asia | 100.0 /100 | #14 | Exceptional 5.3% |
| Immigrants | China | 100.0 /100 | #15 | Exceptional 5.3% |
| Immigrants | Hong Kong | 100.0 /100 | #16 | Exceptional 5.3% |
| Immigrants | Ethiopia | 100.0 /100 | #17 | Exceptional 5.4% |