Dutch West Indian vs Immigrants from Ghana Ambulatory Disability
COMPARE
Dutch West Indian
Immigrants from Ghana
Ambulatory Disability
Ambulatory Disability Comparison
Dutch West Indians
Immigrants from Ghana
8.2%
AMBULATORY DISABILITY
0.0/ 100
METRIC RATING
337th/ 347
METRIC RANK
6.1%
AMBULATORY DISABILITY
41.2/ 100
METRIC RATING
184th/ 347
METRIC RANK
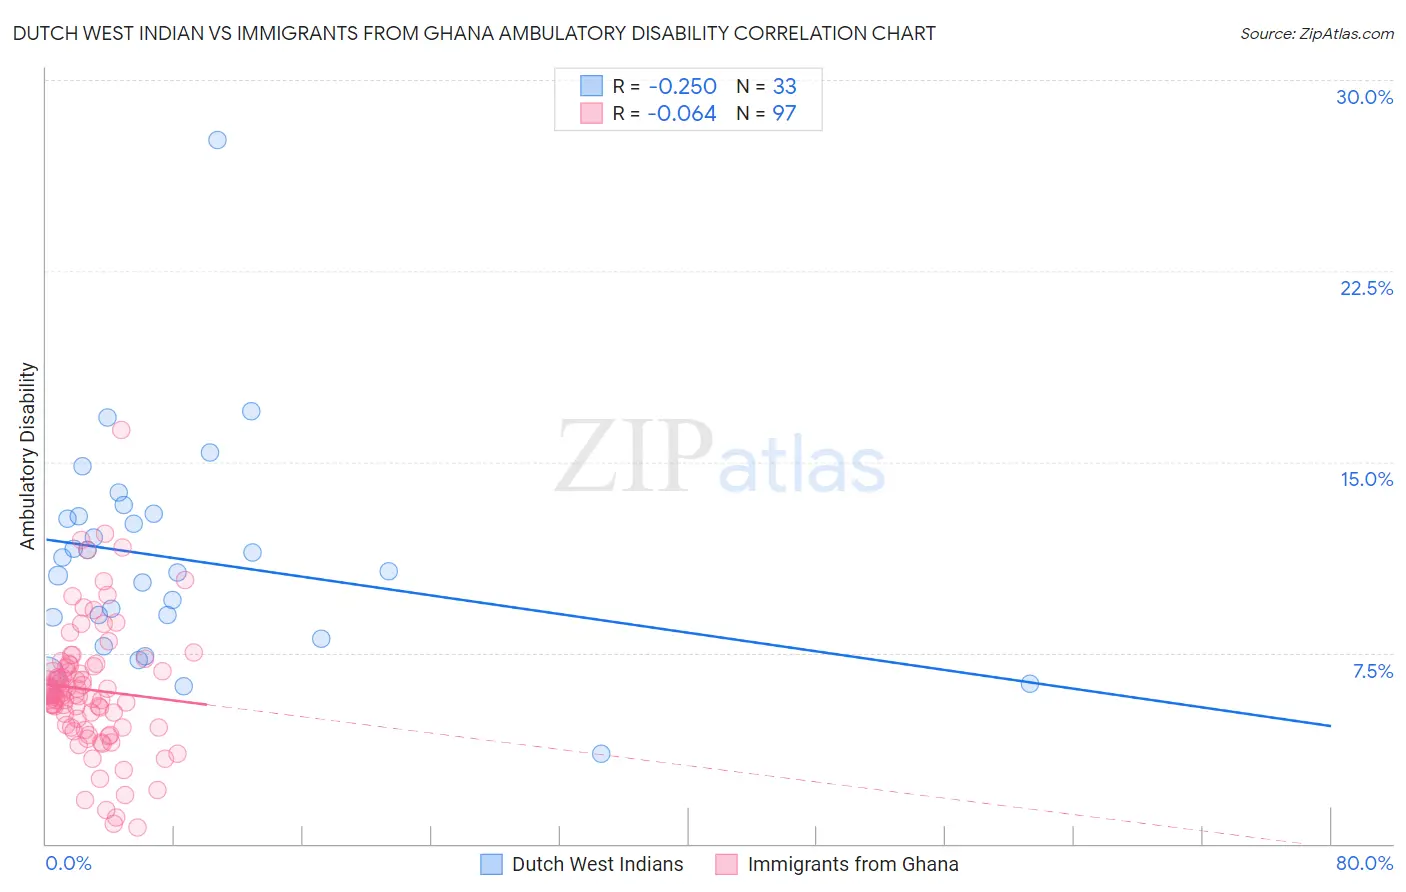
Dutch West Indian vs Immigrants from Ghana Ambulatory Disability Correlation Chart
The statistical analysis conducted on geographies consisting of 85,765,361 people shows a weak negative correlation between the proportion of Dutch West Indians and percentage of population with ambulatory disability in the United States with a correlation coefficient (R) of -0.250 and weighted average of 8.2%. Similarly, the statistical analysis conducted on geographies consisting of 199,872,719 people shows a slight negative correlation between the proportion of Immigrants from Ghana and percentage of population with ambulatory disability in the United States with a correlation coefficient (R) of -0.064 and weighted average of 6.1%, a difference of 32.9%.
Ambulatory Disability Correlation Summary
| Measurement | Dutch West Indian | Immigrants from Ghana |
| Minimum | 3.6% | 0.61% |
| Maximum | 27.7% | 16.2% |
| Range | 24.1% | 15.6% |
| Mean | 11.2% | 6.0% |
| Median | 10.7% | 5.9% |
| Interquartile 25% (IQ1) | 8.5% | 4.6% |
| Interquartile 75% (IQ3) | 12.9% | 7.0% |
| Interquartile Range (IQR) | 4.4% | 2.4% |
| Standard Deviation (Sample) | 4.3% | 2.5% |
| Standard Deviation (Population) | 4.2% | 2.5% |
Similar Demographics by Ambulatory Disability
Demographics Similar to Dutch West Indians by Ambulatory Disability
In terms of ambulatory disability, the demographic groups most similar to Dutch West Indians are Colville (8.2%, a difference of 0.57%), Pima (8.2%, a difference of 0.92%), Seminole (8.0%, a difference of 1.6%), Chickasaw (8.0%, a difference of 1.7%), and Choctaw (8.3%, a difference of 1.8%).
| Demographics | Rating | Rank | Ambulatory Disability |
| Paiute | 0.0 /100 | #330 | Tragic 7.7% |
| Cajuns | 0.0 /100 | #331 | Tragic 7.8% |
| Menominee | 0.0 /100 | #332 | Tragic 7.8% |
| Cherokee | 0.0 /100 | #333 | Tragic 7.9% |
| Yuman | 0.0 /100 | #334 | Tragic 7.9% |
| Chickasaw | 0.0 /100 | #335 | Tragic 8.0% |
| Seminole | 0.0 /100 | #336 | Tragic 8.0% |
| Dutch West Indians | 0.0 /100 | #337 | Tragic 8.2% |
| Colville | 0.0 /100 | #338 | Tragic 8.2% |
| Pima | 0.0 /100 | #339 | Tragic 8.2% |
| Choctaw | 0.0 /100 | #340 | Tragic 8.3% |
| Creek | 0.0 /100 | #341 | Tragic 8.5% |
| Kiowa | 0.0 /100 | #342 | Tragic 8.6% |
| Tohono O'odham | 0.0 /100 | #343 | Tragic 8.7% |
| Tsimshian | 0.0 /100 | #344 | Tragic 8.8% |
Demographics Similar to Immigrants from Ghana by Ambulatory Disability
In terms of ambulatory disability, the demographic groups most similar to Immigrants from Ghana are Immigrants from Thailand (6.1%, a difference of 0.050%), Serbian (6.1%, a difference of 0.090%), Swiss (6.1%, a difference of 0.10%), Austrian (6.1%, a difference of 0.15%), and Immigrants from Nicaragua (6.1%, a difference of 0.15%).
| Demographics | Rating | Rank | Ambulatory Disability |
| Immigrants | England | 45.4 /100 | #177 | Average 6.1% |
| Scandinavians | 44.5 /100 | #178 | Average 6.1% |
| Austrians | 44.1 /100 | #179 | Average 6.1% |
| Immigrants | Nicaragua | 43.9 /100 | #180 | Average 6.1% |
| Swiss | 43.1 /100 | #181 | Average 6.1% |
| Serbians | 42.8 /100 | #182 | Average 6.1% |
| Immigrants | Thailand | 42.2 /100 | #183 | Average 6.1% |
| Immigrants | Ghana | 41.2 /100 | #184 | Average 6.1% |
| Immigrants | Bosnia and Herzegovina | 37.2 /100 | #185 | Fair 6.2% |
| Europeans | 36.2 /100 | #186 | Fair 6.2% |
| Carpatho Rusyns | 35.3 /100 | #187 | Fair 6.2% |
| British | 34.3 /100 | #188 | Fair 6.2% |
| Ukrainians | 34.0 /100 | #189 | Fair 6.2% |
| Immigrants | Western Africa | 33.4 /100 | #190 | Fair 6.2% |
| Immigrants | Guatemala | 31.9 /100 | #191 | Fair 6.2% |