Puerto Rican vs Immigrants from Ghana Ambulatory Disability
COMPARE
Puerto Rican
Immigrants from Ghana
Ambulatory Disability
Ambulatory Disability Comparison
Puerto Ricans
Immigrants from Ghana
8.9%
AMBULATORY DISABILITY
0.0/ 100
METRIC RATING
345th/ 347
METRIC RANK
6.1%
AMBULATORY DISABILITY
41.2/ 100
METRIC RATING
184th/ 347
METRIC RANK
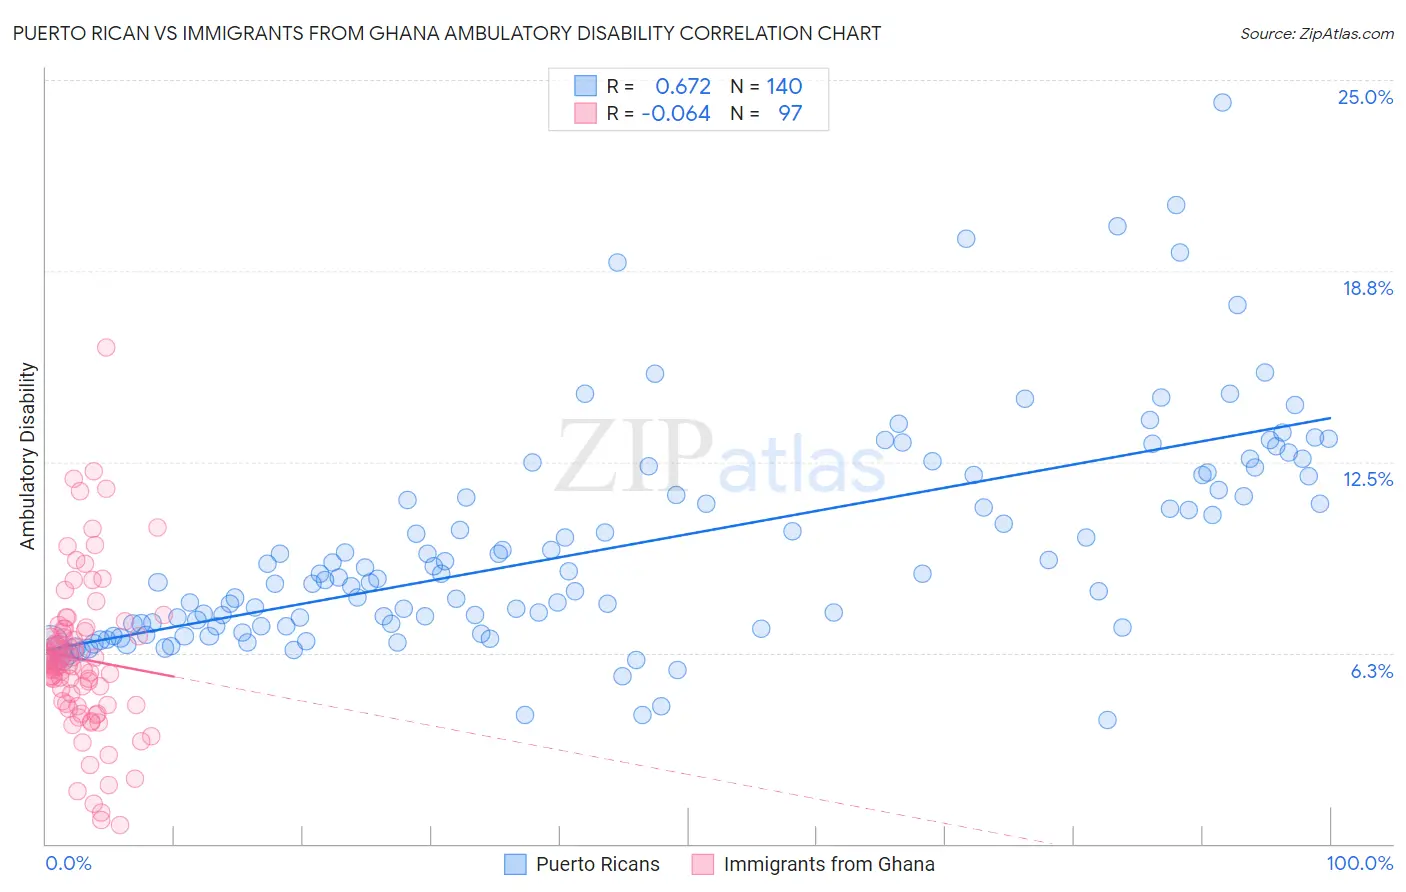
Puerto Rican vs Immigrants from Ghana Ambulatory Disability Correlation Chart
The statistical analysis conducted on geographies consisting of 527,889,782 people shows a significant positive correlation between the proportion of Puerto Ricans and percentage of population with ambulatory disability in the United States with a correlation coefficient (R) of 0.672 and weighted average of 8.9%. Similarly, the statistical analysis conducted on geographies consisting of 199,872,719 people shows a slight negative correlation between the proportion of Immigrants from Ghana and percentage of population with ambulatory disability in the United States with a correlation coefficient (R) of -0.064 and weighted average of 6.1%, a difference of 44.4%.
Ambulatory Disability Correlation Summary
| Measurement | Puerto Rican | Immigrants from Ghana |
| Minimum | 4.0% | 0.61% |
| Maximum | 24.3% | 16.2% |
| Range | 20.2% | 15.6% |
| Mean | 9.7% | 6.0% |
| Median | 8.7% | 5.9% |
| Interquartile 25% (IQ1) | 7.1% | 4.6% |
| Interquartile 75% (IQ3) | 11.8% | 7.0% |
| Interquartile Range (IQR) | 4.7% | 2.4% |
| Standard Deviation (Sample) | 3.6% | 2.5% |
| Standard Deviation (Population) | 3.6% | 2.5% |
Similar Demographics by Ambulatory Disability
Demographics Similar to Puerto Ricans by Ambulatory Disability
In terms of ambulatory disability, the demographic groups most similar to Puerto Ricans are Tsimshian (8.8%, a difference of 0.59%), Tohono O'odham (8.7%, a difference of 1.6%), Kiowa (8.6%, a difference of 3.1%), Houma (9.3%, a difference of 4.9%), and Creek (8.5%, a difference of 5.0%).
| Demographics | Rating | Rank | Ambulatory Disability |
| Cherokee | 0.0 /100 | #333 | Tragic 7.9% |
| Yuman | 0.0 /100 | #334 | Tragic 7.9% |
| Chickasaw | 0.0 /100 | #335 | Tragic 8.0% |
| Seminole | 0.0 /100 | #336 | Tragic 8.0% |
| Dutch West Indians | 0.0 /100 | #337 | Tragic 8.2% |
| Colville | 0.0 /100 | #338 | Tragic 8.2% |
| Pima | 0.0 /100 | #339 | Tragic 8.2% |
| Choctaw | 0.0 /100 | #340 | Tragic 8.3% |
| Creek | 0.0 /100 | #341 | Tragic 8.5% |
| Kiowa | 0.0 /100 | #342 | Tragic 8.6% |
| Tohono O'odham | 0.0 /100 | #343 | Tragic 8.7% |
| Tsimshian | 0.0 /100 | #344 | Tragic 8.8% |
| Puerto Ricans | 0.0 /100 | #345 | Tragic 8.9% |
| Houma | 0.0 /100 | #346 | Tragic 9.3% |
| Lumbee | 0.0 /100 | #347 | Tragic 9.5% |
Demographics Similar to Immigrants from Ghana by Ambulatory Disability
In terms of ambulatory disability, the demographic groups most similar to Immigrants from Ghana are Immigrants from Thailand (6.1%, a difference of 0.050%), Serbian (6.1%, a difference of 0.090%), Swiss (6.1%, a difference of 0.10%), Austrian (6.1%, a difference of 0.15%), and Immigrants from Nicaragua (6.1%, a difference of 0.15%).
| Demographics | Rating | Rank | Ambulatory Disability |
| Immigrants | England | 45.4 /100 | #177 | Average 6.1% |
| Scandinavians | 44.5 /100 | #178 | Average 6.1% |
| Austrians | 44.1 /100 | #179 | Average 6.1% |
| Immigrants | Nicaragua | 43.9 /100 | #180 | Average 6.1% |
| Swiss | 43.1 /100 | #181 | Average 6.1% |
| Serbians | 42.8 /100 | #182 | Average 6.1% |
| Immigrants | Thailand | 42.2 /100 | #183 | Average 6.1% |
| Immigrants | Ghana | 41.2 /100 | #184 | Average 6.1% |
| Immigrants | Bosnia and Herzegovina | 37.2 /100 | #185 | Fair 6.2% |
| Europeans | 36.2 /100 | #186 | Fair 6.2% |
| Carpatho Rusyns | 35.3 /100 | #187 | Fair 6.2% |
| British | 34.3 /100 | #188 | Fair 6.2% |
| Ukrainians | 34.0 /100 | #189 | Fair 6.2% |
| Immigrants | Western Africa | 33.4 /100 | #190 | Fair 6.2% |
| Immigrants | Guatemala | 31.9 /100 | #191 | Fair 6.2% |