Dutch West Indian vs Immigrants from Ghana Births to Unmarried Women
COMPARE
Dutch West Indian
Immigrants from Ghana
Births to Unmarried Women
Births to Unmarried Women Comparison
Dutch West Indians
Immigrants from Ghana
38.4%
BIRTHS TO UNMARRIED WOMEN
0.0/ 100
METRIC RATING
297th/ 347
METRIC RANK
34.5%
BIRTHS TO UNMARRIED WOMEN
2.2/ 100
METRIC RATING
235th/ 347
METRIC RANK
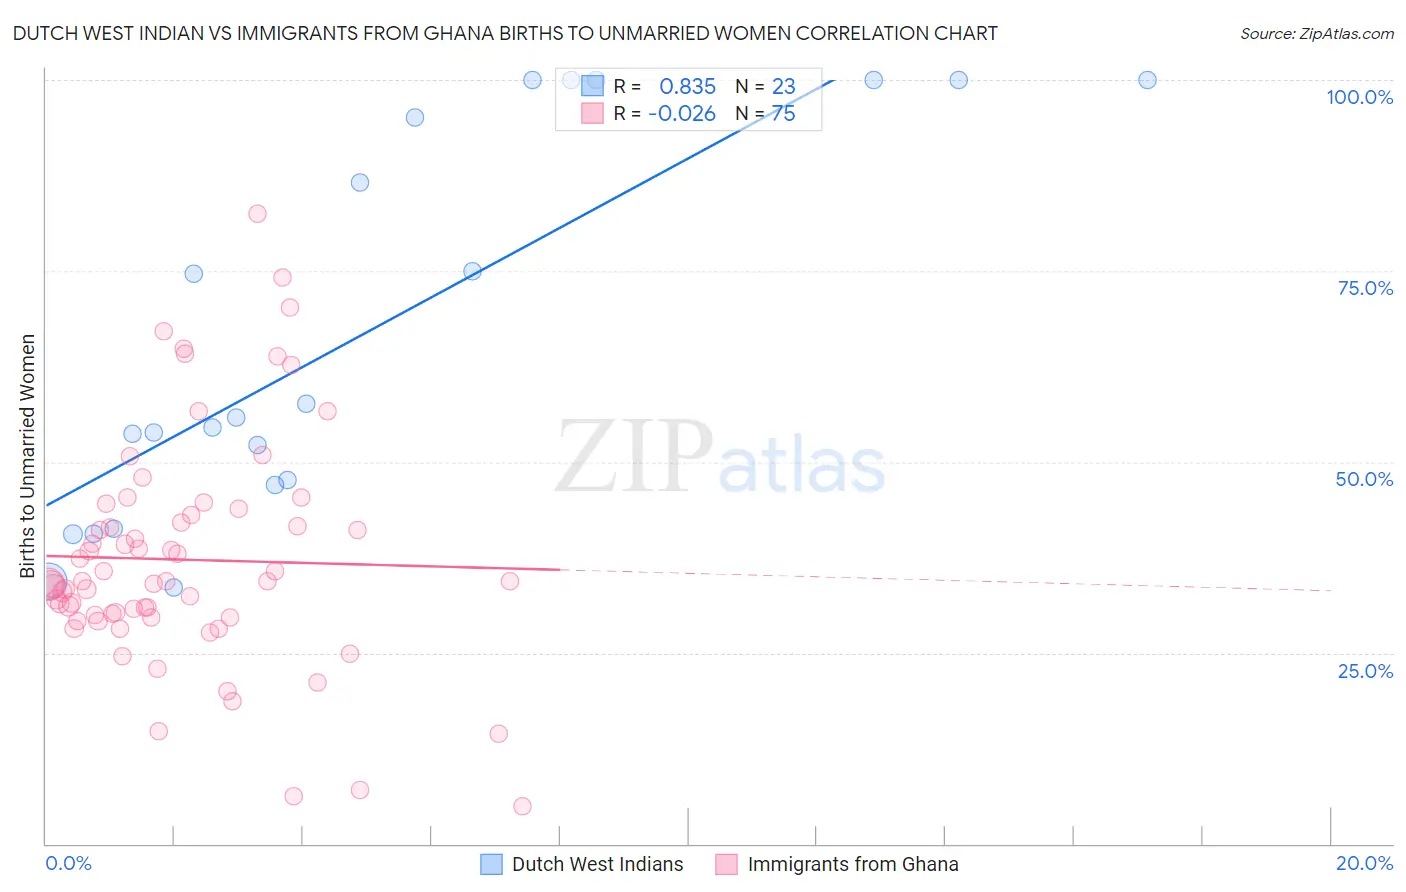
Dutch West Indian vs Immigrants from Ghana Births to Unmarried Women Correlation Chart
The statistical analysis conducted on geographies consisting of 84,269,564 people shows a very strong positive correlation between the proportion of Dutch West Indians and percentage of births to unmarried women in the United States with a correlation coefficient (R) of 0.835 and weighted average of 38.4%. Similarly, the statistical analysis conducted on geographies consisting of 193,200,856 people shows no correlation between the proportion of Immigrants from Ghana and percentage of births to unmarried women in the United States with a correlation coefficient (R) of -0.026 and weighted average of 34.5%, a difference of 11.3%.
Births to Unmarried Women Correlation Summary
| Measurement | Dutch West Indian | Immigrants from Ghana |
| Minimum | 33.6% | 4.9% |
| Maximum | 100.0% | 82.5% |
| Range | 66.4% | 77.6% |
| Mean | 67.1% | 37.2% |
| Median | 55.9% | 34.4% |
| Interquartile 25% (IQ1) | 47.0% | 29.7% |
| Interquartile 75% (IQ3) | 100.0% | 43.0% |
| Interquartile Range (IQR) | 53.0% | 13.3% |
| Standard Deviation (Sample) | 25.0% | 14.9% |
| Standard Deviation (Population) | 24.5% | 14.8% |
Similar Demographics by Births to Unmarried Women
Demographics Similar to Dutch West Indians by Births to Unmarried Women
In terms of births to unmarried women, the demographic groups most similar to Dutch West Indians are Jamaican (38.5%, a difference of 0.20%), Alaska Native (38.3%, a difference of 0.28%), Spanish American (38.6%, a difference of 0.40%), Immigrants from West Indies (38.6%, a difference of 0.46%), and Haitian (38.6%, a difference of 0.47%).
| Demographics | Rating | Rank | Births to Unmarried Women |
| Hispanics or Latinos | 0.0 /100 | #290 | Tragic 37.8% |
| Seminole | 0.0 /100 | #291 | Tragic 37.9% |
| Blackfeet | 0.0 /100 | #292 | Tragic 37.9% |
| Immigrants | Nicaragua | 0.0 /100 | #293 | Tragic 38.0% |
| British West Indians | 0.0 /100 | #294 | Tragic 38.0% |
| Iroquois | 0.0 /100 | #295 | Tragic 38.2% |
| Alaska Natives | 0.0 /100 | #296 | Tragic 38.3% |
| Dutch West Indians | 0.0 /100 | #297 | Tragic 38.4% |
| Jamaicans | 0.0 /100 | #298 | Tragic 38.5% |
| Spanish Americans | 0.0 /100 | #299 | Tragic 38.6% |
| Immigrants | West Indies | 0.0 /100 | #300 | Tragic 38.6% |
| Haitians | 0.0 /100 | #301 | Tragic 38.6% |
| Hondurans | 0.0 /100 | #302 | Tragic 38.7% |
| Immigrants | Jamaica | 0.0 /100 | #303 | Tragic 38.8% |
| Yaqui | 0.0 /100 | #304 | Tragic 38.8% |
Demographics Similar to Immigrants from Ghana by Births to Unmarried Women
In terms of births to unmarried women, the demographic groups most similar to Immigrants from Ghana are Immigrants from Zaire (34.5%, a difference of 0.070%), Bangladeshi (34.4%, a difference of 0.31%), French Canadian (34.4%, a difference of 0.33%), Native Hawaiian (34.3%, a difference of 0.62%), and Immigrants from Cameroon (34.7%, a difference of 0.63%).
| Demographics | Rating | Rank | Births to Unmarried Women |
| Panamanians | 3.3 /100 | #228 | Tragic 34.2% |
| Immigrants | Sierra Leone | 3.1 /100 | #229 | Tragic 34.2% |
| Ghanaians | 3.1 /100 | #230 | Tragic 34.3% |
| Native Hawaiians | 2.9 /100 | #231 | Tragic 34.3% |
| French Canadians | 2.5 /100 | #232 | Tragic 34.4% |
| Bangladeshis | 2.5 /100 | #233 | Tragic 34.4% |
| Immigrants | Zaire | 2.3 /100 | #234 | Tragic 34.5% |
| Immigrants | Ghana | 2.2 /100 | #235 | Tragic 34.5% |
| Immigrants | Cameroon | 1.6 /100 | #236 | Tragic 34.7% |
| Marshallese | 1.6 /100 | #237 | Tragic 34.8% |
| Immigrants | Cambodia | 1.6 /100 | #238 | Tragic 34.8% |
| Sierra Leoneans | 1.4 /100 | #239 | Tragic 34.9% |
| Immigrants | Middle Africa | 1.2 /100 | #240 | Tragic 34.9% |
| Immigrants | Guyana | 1.2 /100 | #241 | Tragic 35.0% |
| Indonesians | 1.2 /100 | #242 | Tragic 35.0% |