Dutch West Indian vs Estonian Female Disability
COMPARE
Dutch West Indian
Estonian
Female Disability
Female Disability Comparison
Dutch West Indians
Estonians
15.0%
FEMALE DISABILITY
0.0/ 100
METRIC RATING
338th/ 347
METRIC RANK
12.0%
FEMALE DISABILITY
87.8/ 100
METRIC RATING
145th/ 347
METRIC RANK
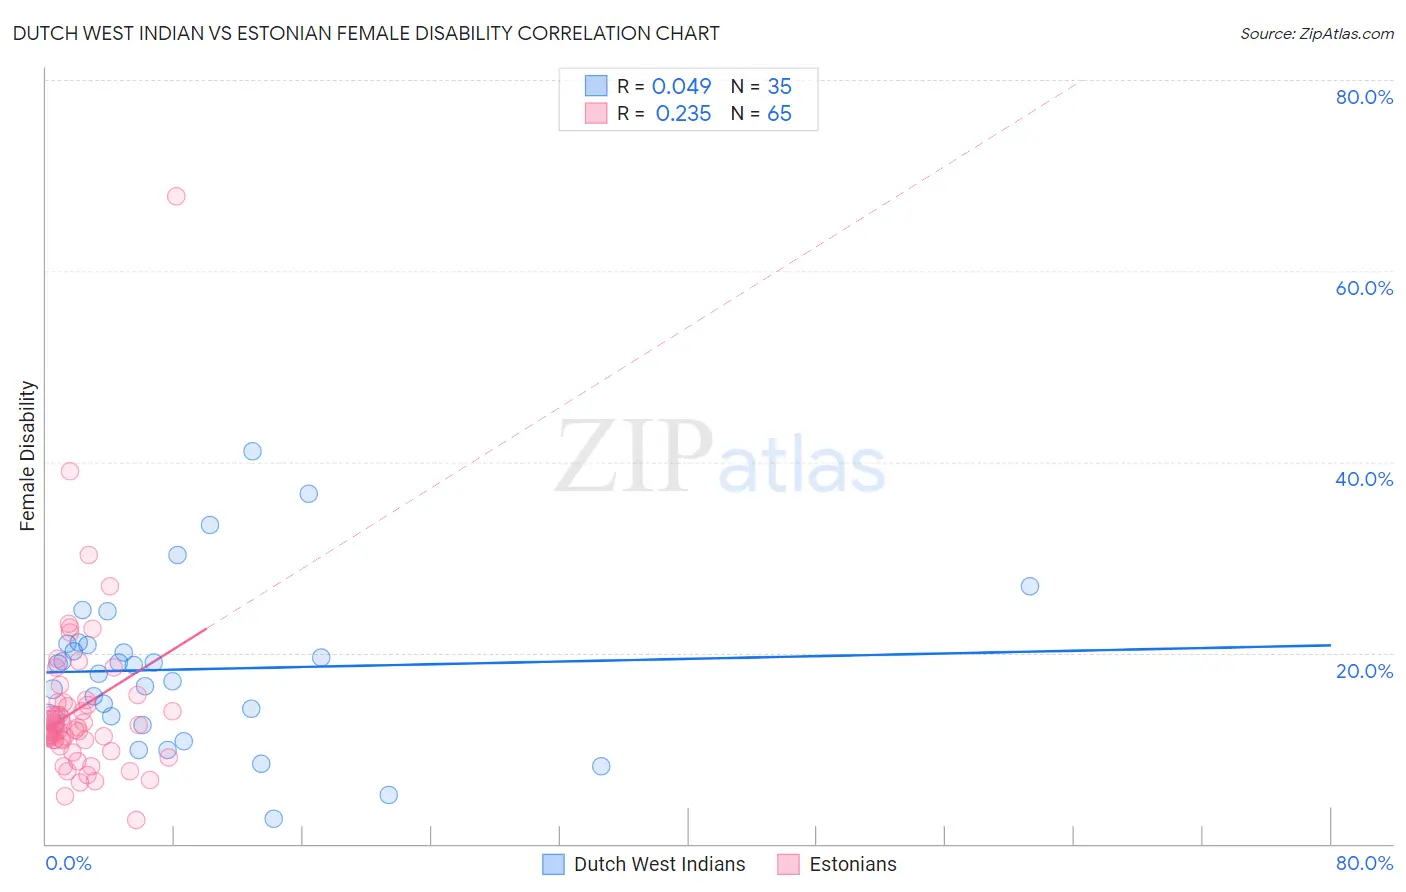
Dutch West Indian vs Estonian Female Disability Correlation Chart
The statistical analysis conducted on geographies consisting of 85,770,005 people shows no correlation between the proportion of Dutch West Indians and percentage of females with a disability in the United States with a correlation coefficient (R) of 0.049 and weighted average of 15.0%. Similarly, the statistical analysis conducted on geographies consisting of 123,526,359 people shows a weak positive correlation between the proportion of Estonians and percentage of females with a disability in the United States with a correlation coefficient (R) of 0.235 and weighted average of 12.0%, a difference of 25.4%.
Female Disability Correlation Summary
| Measurement | Dutch West Indian | Estonian |
| Minimum | 2.6% | 2.4% |
| Maximum | 41.1% | 67.8% |
| Range | 38.5% | 65.4% |
| Mean | 18.3% | 14.2% |
| Median | 18.7% | 12.1% |
| Interquartile 25% (IQ1) | 12.8% | 10.8% |
| Interquartile 75% (IQ3) | 21.0% | 14.8% |
| Interquartile Range (IQR) | 8.2% | 3.9% |
| Standard Deviation (Sample) | 8.3% | 9.0% |
| Standard Deviation (Population) | 8.2% | 8.9% |
Similar Demographics by Female Disability
Demographics Similar to Dutch West Indians by Female Disability
In terms of female disability, the demographic groups most similar to Dutch West Indians are Tohono O'odham (15.0%, a difference of 0.14%), Seminole (15.0%, a difference of 0.26%), Colville (15.1%, a difference of 0.40%), Cajun (14.9%, a difference of 0.94%), and Cherokee (14.9%, a difference of 0.96%).
| Demographics | Rating | Rank | Female Disability |
| Immigrants | Cabo Verde | 0.0 /100 | #331 | Tragic 14.6% |
| Pima | 0.0 /100 | #332 | Tragic 14.8% |
| Immigrants | Azores | 0.0 /100 | #333 | Tragic 14.9% |
| Cherokee | 0.0 /100 | #334 | Tragic 14.9% |
| Cajuns | 0.0 /100 | #335 | Tragic 14.9% |
| Seminole | 0.0 /100 | #336 | Tragic 15.0% |
| Tohono O'odham | 0.0 /100 | #337 | Tragic 15.0% |
| Dutch West Indians | 0.0 /100 | #338 | Tragic 15.0% |
| Colville | 0.0 /100 | #339 | Tragic 15.1% |
| Chickasaw | 0.0 /100 | #340 | Tragic 15.2% |
| Choctaw | 0.0 /100 | #341 | Tragic 15.4% |
| Creek | 0.0 /100 | #342 | Tragic 15.7% |
| Lumbee | 0.0 /100 | #343 | Tragic 15.8% |
| Kiowa | 0.0 /100 | #344 | Tragic 15.8% |
| Puerto Ricans | 0.0 /100 | #345 | Tragic 16.6% |
Demographics Similar to Estonians by Female Disability
In terms of female disability, the demographic groups most similar to Estonians are Immigrants from Austria (12.0%, a difference of 0.0%), Immigrants from Sudan (11.9%, a difference of 0.17%), Immigrants from Africa (11.9%, a difference of 0.21%), Pakistani (12.0%, a difference of 0.26%), and Nigerian (12.0%, a difference of 0.30%).
| Demographics | Rating | Rank | Female Disability |
| Ecuadorians | 93.4 /100 | #138 | Exceptional 11.9% |
| Immigrants | Hungary | 92.8 /100 | #139 | Exceptional 11.9% |
| Romanians | 91.6 /100 | #140 | Exceptional 11.9% |
| Immigrants | Ecuador | 91.5 /100 | #141 | Exceptional 11.9% |
| Immigrants | Africa | 90.0 /100 | #142 | Excellent 11.9% |
| Immigrants | Sudan | 89.6 /100 | #143 | Excellent 11.9% |
| Immigrants | Austria | 87.9 /100 | #144 | Excellent 12.0% |
| Estonians | 87.8 /100 | #145 | Excellent 12.0% |
| Pakistanis | 84.6 /100 | #146 | Excellent 12.0% |
| Nigerians | 84.0 /100 | #147 | Excellent 12.0% |
| Immigrants | Kenya | 83.1 /100 | #148 | Excellent 12.0% |
| Greeks | 82.0 /100 | #149 | Excellent 12.0% |
| Immigrants | Moldova | 81.4 /100 | #150 | Excellent 12.0% |
| Icelanders | 80.7 /100 | #151 | Excellent 12.0% |
| Immigrants | Scotland | 79.3 /100 | #152 | Good 12.0% |