Dutch West Indian vs Costa Rican Female Disability
COMPARE
Dutch West Indian
Costa Rican
Female Disability
Female Disability Comparison
Dutch West Indians
Costa Ricans
15.0%
FEMALE DISABILITY
0.0/ 100
METRIC RATING
338th/ 347
METRIC RANK
11.7%
FEMALE DISABILITY
98.1/ 100
METRIC RATING
111th/ 347
METRIC RANK
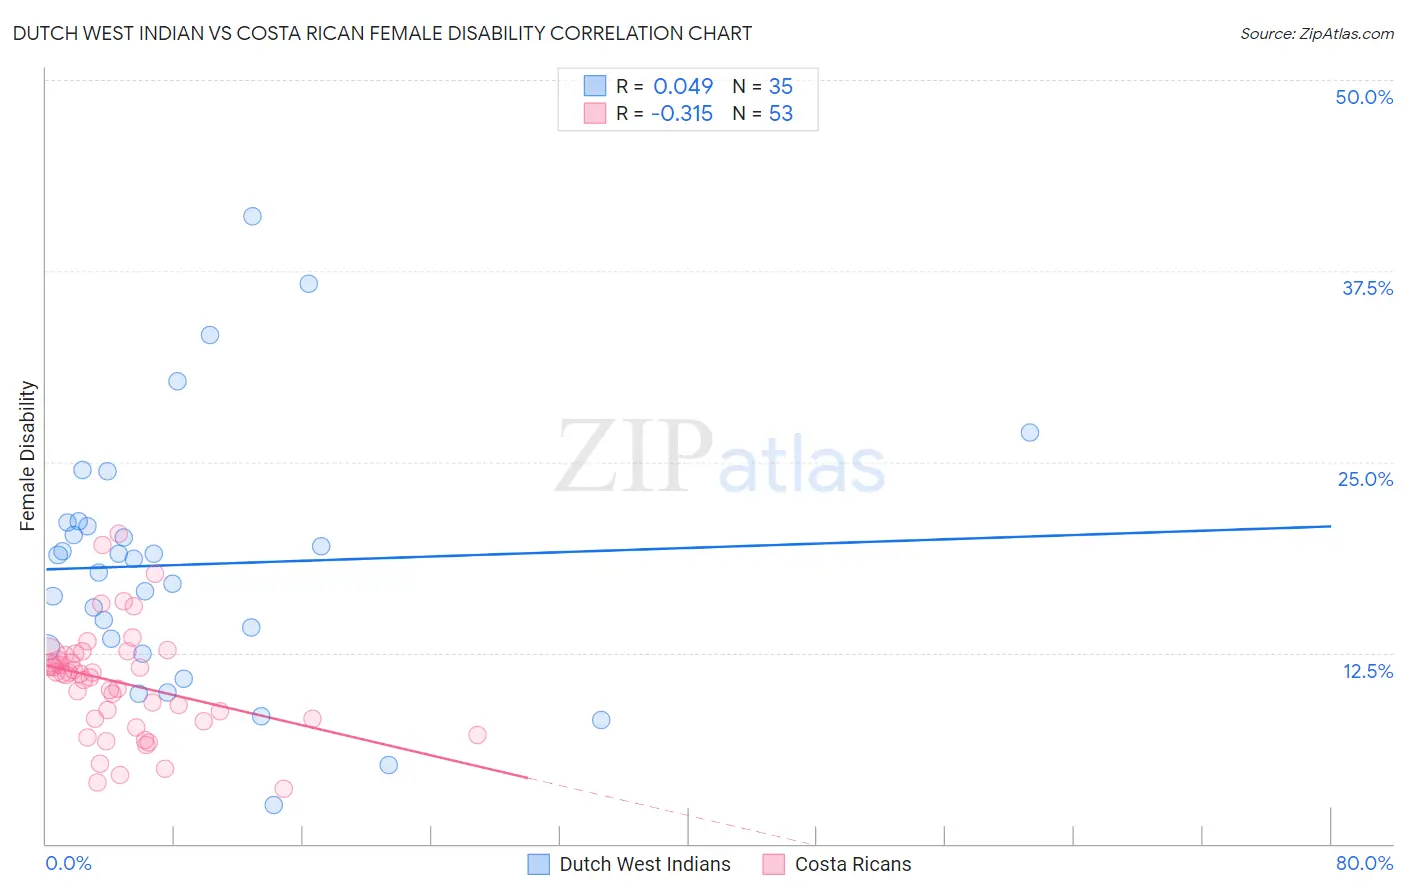
Dutch West Indian vs Costa Rican Female Disability Correlation Chart
The statistical analysis conducted on geographies consisting of 85,770,005 people shows no correlation between the proportion of Dutch West Indians and percentage of females with a disability in the United States with a correlation coefficient (R) of 0.049 and weighted average of 15.0%. Similarly, the statistical analysis conducted on geographies consisting of 253,556,053 people shows a mild negative correlation between the proportion of Costa Ricans and percentage of females with a disability in the United States with a correlation coefficient (R) of -0.315 and weighted average of 11.7%, a difference of 27.8%.
Female Disability Correlation Summary
| Measurement | Dutch West Indian | Costa Rican |
| Minimum | 2.6% | 3.6% |
| Maximum | 41.1% | 20.3% |
| Range | 38.5% | 16.7% |
| Mean | 18.3% | 10.6% |
| Median | 18.7% | 11.1% |
| Interquartile 25% (IQ1) | 12.8% | 8.1% |
| Interquartile 75% (IQ3) | 21.0% | 12.3% |
| Interquartile Range (IQR) | 8.2% | 4.2% |
| Standard Deviation (Sample) | 8.3% | 3.6% |
| Standard Deviation (Population) | 8.2% | 3.6% |
Similar Demographics by Female Disability
Demographics Similar to Dutch West Indians by Female Disability
In terms of female disability, the demographic groups most similar to Dutch West Indians are Tohono O'odham (15.0%, a difference of 0.14%), Seminole (15.0%, a difference of 0.26%), Colville (15.1%, a difference of 0.40%), Cajun (14.9%, a difference of 0.94%), and Cherokee (14.9%, a difference of 0.96%).
| Demographics | Rating | Rank | Female Disability |
| Immigrants | Cabo Verde | 0.0 /100 | #331 | Tragic 14.6% |
| Pima | 0.0 /100 | #332 | Tragic 14.8% |
| Immigrants | Azores | 0.0 /100 | #333 | Tragic 14.9% |
| Cherokee | 0.0 /100 | #334 | Tragic 14.9% |
| Cajuns | 0.0 /100 | #335 | Tragic 14.9% |
| Seminole | 0.0 /100 | #336 | Tragic 15.0% |
| Tohono O'odham | 0.0 /100 | #337 | Tragic 15.0% |
| Dutch West Indians | 0.0 /100 | #338 | Tragic 15.0% |
| Colville | 0.0 /100 | #339 | Tragic 15.1% |
| Chickasaw | 0.0 /100 | #340 | Tragic 15.2% |
| Choctaw | 0.0 /100 | #341 | Tragic 15.4% |
| Creek | 0.0 /100 | #342 | Tragic 15.7% |
| Lumbee | 0.0 /100 | #343 | Tragic 15.8% |
| Kiowa | 0.0 /100 | #344 | Tragic 15.8% |
| Puerto Ricans | 0.0 /100 | #345 | Tragic 16.6% |
Demographics Similar to Costa Ricans by Female Disability
In terms of female disability, the demographic groups most similar to Costa Ricans are Immigrants (11.7%, a difference of 0.020%), Soviet Union (11.7%, a difference of 0.020%), New Zealander (11.7%, a difference of 0.050%), Latvian (11.7%, a difference of 0.070%), and Immigrants from Greece (11.7%, a difference of 0.090%).
| Demographics | Rating | Rank | Female Disability |
| Immigrants | Western Asia | 98.3 /100 | #104 | Exceptional 11.7% |
| Australians | 98.3 /100 | #105 | Exceptional 11.7% |
| Immigrants | Greece | 98.2 /100 | #106 | Exceptional 11.7% |
| Latvians | 98.2 /100 | #107 | Exceptional 11.7% |
| New Zealanders | 98.1 /100 | #108 | Exceptional 11.7% |
| Immigrants | Immigrants | 98.1 /100 | #109 | Exceptional 11.7% |
| Soviet Union | 98.1 /100 | #110 | Exceptional 11.7% |
| Costa Ricans | 98.1 /100 | #111 | Exceptional 11.7% |
| Immigrants | Bangladesh | 97.8 /100 | #112 | Exceptional 11.8% |
| Immigrants | Belarus | 97.8 /100 | #113 | Exceptional 11.8% |
| South Africans | 97.7 /100 | #114 | Exceptional 11.8% |
| Brazilians | 97.7 /100 | #115 | Exceptional 11.8% |
| Immigrants | Morocco | 97.6 /100 | #116 | Exceptional 11.8% |
| Immigrants | Eastern Europe | 97.2 /100 | #117 | Exceptional 11.8% |
| Immigrants | Nigeria | 97.2 /100 | #118 | Exceptional 11.8% |