Aleut vs Estonian Female Disability
COMPARE
Aleut
Estonian
Female Disability
Female Disability Comparison
Aleuts
Estonians
12.7%
FEMALE DISABILITY
1.1/ 100
METRIC RATING
258th/ 347
METRIC RANK
12.0%
FEMALE DISABILITY
87.8/ 100
METRIC RATING
145th/ 347
METRIC RANK
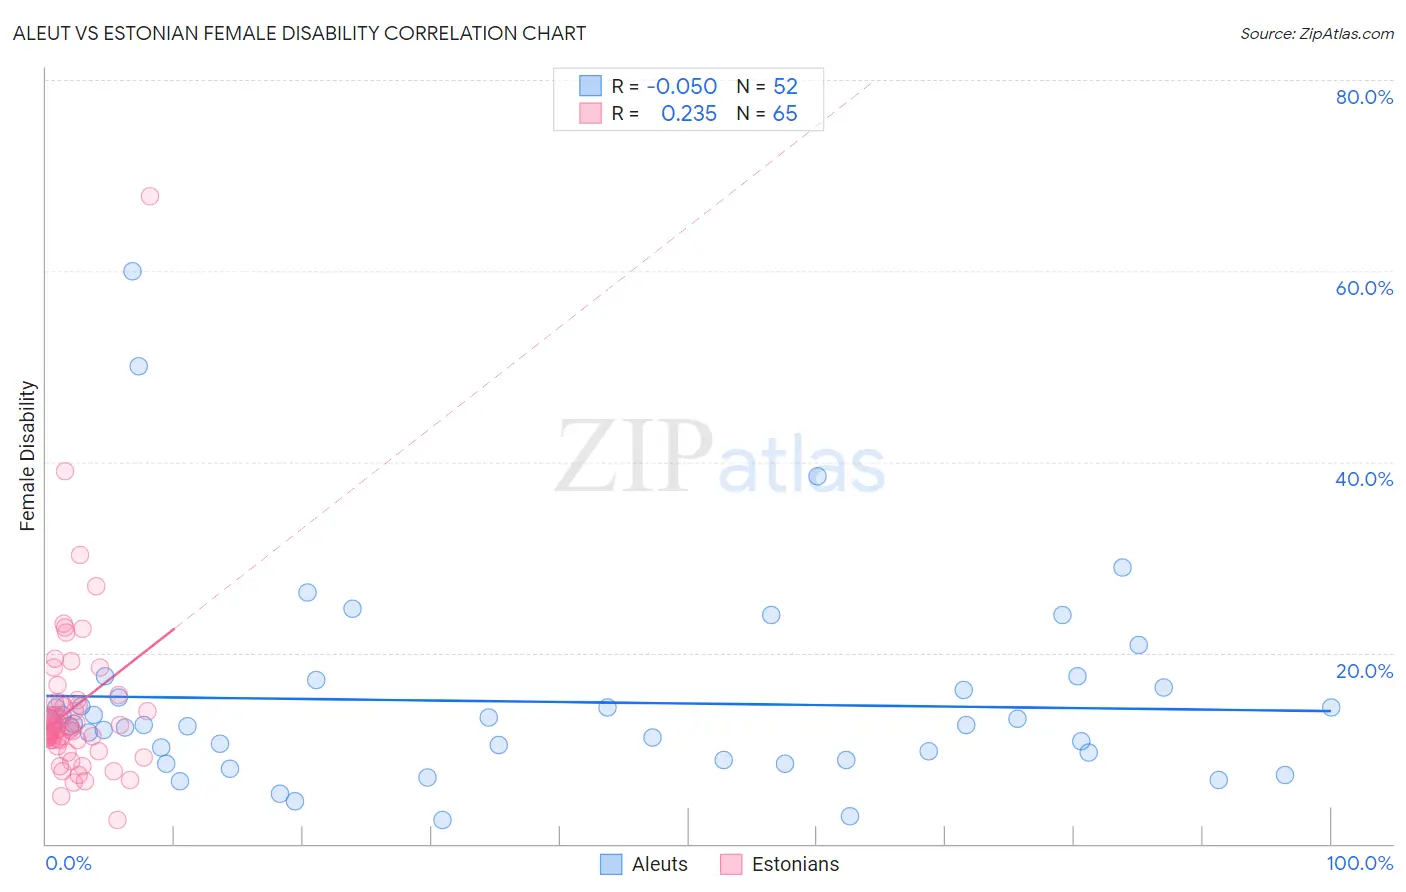
Aleut vs Estonian Female Disability Correlation Chart
The statistical analysis conducted on geographies consisting of 61,781,040 people shows no correlation between the proportion of Aleuts and percentage of females with a disability in the United States with a correlation coefficient (R) of -0.050 and weighted average of 12.7%. Similarly, the statistical analysis conducted on geographies consisting of 123,526,359 people shows a weak positive correlation between the proportion of Estonians and percentage of females with a disability in the United States with a correlation coefficient (R) of 0.235 and weighted average of 12.0%, a difference of 6.2%.
Female Disability Correlation Summary
| Measurement | Aleut | Estonian |
| Minimum | 2.5% | 2.4% |
| Maximum | 60.0% | 67.8% |
| Range | 57.5% | 65.4% |
| Mean | 14.9% | 14.2% |
| Median | 12.5% | 12.1% |
| Interquartile 25% (IQ1) | 9.2% | 10.8% |
| Interquartile 75% (IQ3) | 16.2% | 14.8% |
| Interquartile Range (IQR) | 7.0% | 3.9% |
| Standard Deviation (Sample) | 10.5% | 9.0% |
| Standard Deviation (Population) | 10.4% | 8.9% |
Similar Demographics by Female Disability
Demographics Similar to Aleuts by Female Disability
In terms of female disability, the demographic groups most similar to Aleuts are Liberian (12.7%, a difference of 0.0%), British West Indian (12.7%, a difference of 0.030%), Immigrants from Armenia (12.7%, a difference of 0.080%), Subsaharan African (12.7%, a difference of 0.090%), and Immigrants from Germany (12.7%, a difference of 0.10%).
| Demographics | Rating | Rank | Female Disability |
| Crow | 1.6 /100 | #251 | Tragic 12.7% |
| Immigrants | Caribbean | 1.4 /100 | #252 | Tragic 12.7% |
| Jamaicans | 1.4 /100 | #253 | Tragic 12.7% |
| Hawaiians | 1.4 /100 | #254 | Tragic 12.7% |
| Immigrants | Germany | 1.3 /100 | #255 | Tragic 12.7% |
| British West Indians | 1.2 /100 | #256 | Tragic 12.7% |
| Liberians | 1.1 /100 | #257 | Tragic 12.7% |
| Aleuts | 1.1 /100 | #258 | Tragic 12.7% |
| Immigrants | Armenia | 1.0 /100 | #259 | Tragic 12.7% |
| Sub-Saharan Africans | 1.0 /100 | #260 | Tragic 12.7% |
| Bermudans | 1.0 /100 | #261 | Tragic 12.7% |
| Czechoslovakians | 0.9 /100 | #262 | Tragic 12.7% |
| Spaniards | 0.7 /100 | #263 | Tragic 12.8% |
| Alaska Natives | 0.6 /100 | #264 | Tragic 12.8% |
| West Indians | 0.5 /100 | #265 | Tragic 12.8% |
Demographics Similar to Estonians by Female Disability
In terms of female disability, the demographic groups most similar to Estonians are Immigrants from Austria (12.0%, a difference of 0.0%), Immigrants from Sudan (11.9%, a difference of 0.17%), Immigrants from Africa (11.9%, a difference of 0.21%), Pakistani (12.0%, a difference of 0.26%), and Nigerian (12.0%, a difference of 0.30%).
| Demographics | Rating | Rank | Female Disability |
| Ecuadorians | 93.4 /100 | #138 | Exceptional 11.9% |
| Immigrants | Hungary | 92.8 /100 | #139 | Exceptional 11.9% |
| Romanians | 91.6 /100 | #140 | Exceptional 11.9% |
| Immigrants | Ecuador | 91.5 /100 | #141 | Exceptional 11.9% |
| Immigrants | Africa | 90.0 /100 | #142 | Excellent 11.9% |
| Immigrants | Sudan | 89.6 /100 | #143 | Excellent 11.9% |
| Immigrants | Austria | 87.9 /100 | #144 | Excellent 12.0% |
| Estonians | 87.8 /100 | #145 | Excellent 12.0% |
| Pakistanis | 84.6 /100 | #146 | Excellent 12.0% |
| Nigerians | 84.0 /100 | #147 | Excellent 12.0% |
| Immigrants | Kenya | 83.1 /100 | #148 | Excellent 12.0% |
| Greeks | 82.0 /100 | #149 | Excellent 12.0% |
| Immigrants | Moldova | 81.4 /100 | #150 | Excellent 12.0% |
| Icelanders | 80.7 /100 | #151 | Excellent 12.0% |
| Immigrants | Scotland | 79.3 /100 | #152 | Good 12.0% |