Comanche vs Estonian Female Disability
COMPARE
Comanche
Estonian
Female Disability
Female Disability Comparison
Comanche
Estonians
14.2%
FEMALE DISABILITY
0.0/ 100
METRIC RATING
326th/ 347
METRIC RANK
12.0%
FEMALE DISABILITY
87.8/ 100
METRIC RATING
145th/ 347
METRIC RANK
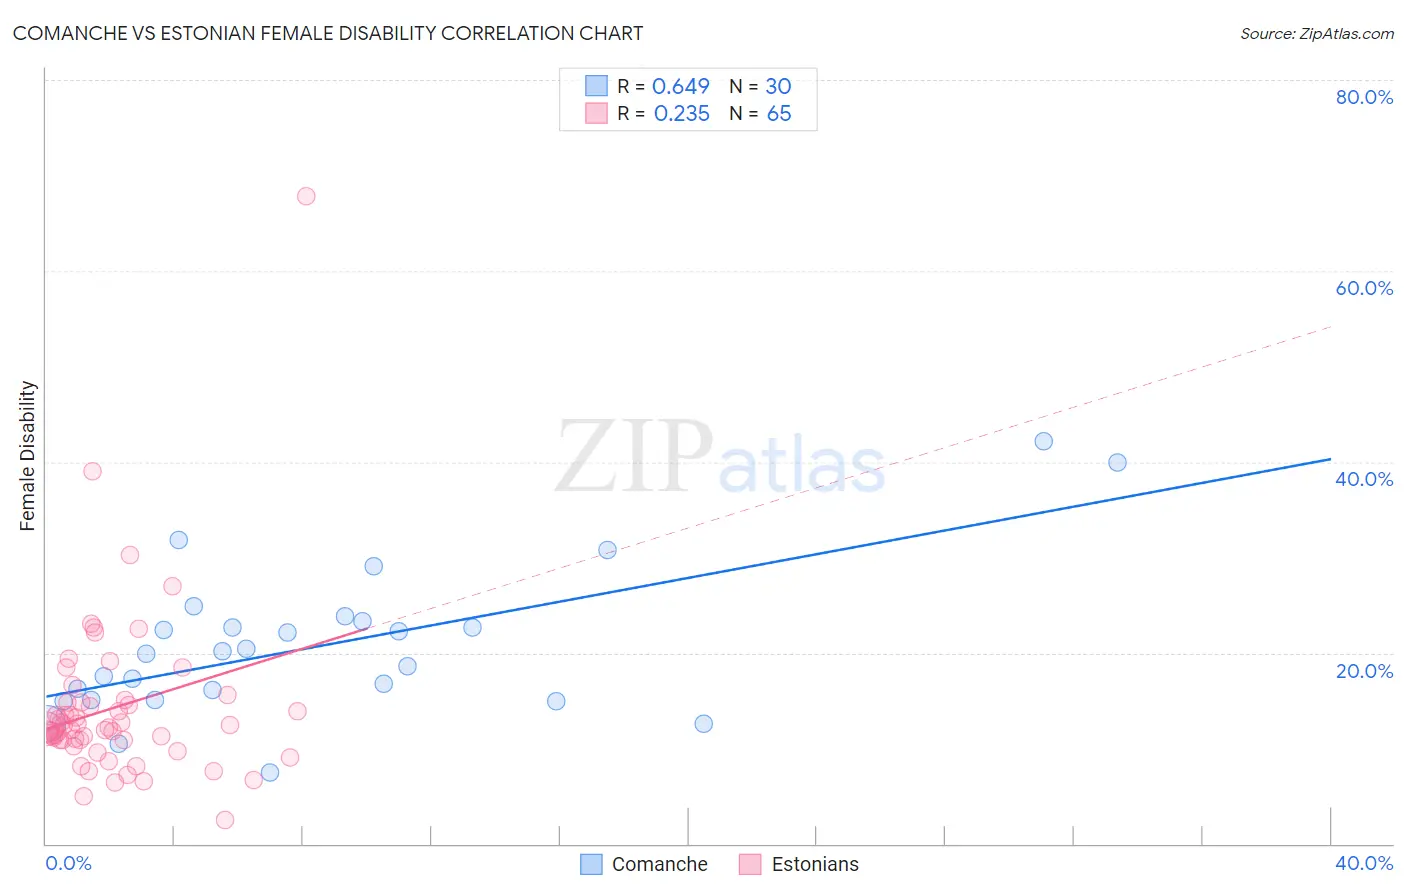
Comanche vs Estonian Female Disability Correlation Chart
The statistical analysis conducted on geographies consisting of 109,776,573 people shows a significant positive correlation between the proportion of Comanche and percentage of females with a disability in the United States with a correlation coefficient (R) of 0.649 and weighted average of 14.2%. Similarly, the statistical analysis conducted on geographies consisting of 123,526,359 people shows a weak positive correlation between the proportion of Estonians and percentage of females with a disability in the United States with a correlation coefficient (R) of 0.235 and weighted average of 12.0%, a difference of 18.5%.
Female Disability Correlation Summary
| Measurement | Comanche | Estonian |
| Minimum | 7.4% | 2.4% |
| Maximum | 42.1% | 67.8% |
| Range | 34.7% | 65.4% |
| Mean | 20.8% | 14.2% |
| Median | 20.0% | 12.1% |
| Interquartile 25% (IQ1) | 15.1% | 10.8% |
| Interquartile 75% (IQ3) | 23.2% | 14.8% |
| Interquartile Range (IQR) | 8.1% | 3.9% |
| Standard Deviation (Sample) | 7.9% | 9.0% |
| Standard Deviation (Population) | 7.7% | 8.9% |
Similar Demographics by Female Disability
Demographics Similar to Comanche by Female Disability
In terms of female disability, the demographic groups most similar to Comanche are Navajo (14.2%, a difference of 0.11%), Native/Alaskan (14.1%, a difference of 0.25%), Black/African American (14.1%, a difference of 0.27%), Pueblo (14.1%, a difference of 0.43%), and Potawatomi (14.1%, a difference of 0.44%).
| Demographics | Rating | Rank | Female Disability |
| Iroquois | 0.0 /100 | #319 | Tragic 14.0% |
| Americans | 0.0 /100 | #320 | Tragic 14.1% |
| Potawatomi | 0.0 /100 | #321 | Tragic 14.1% |
| Pueblo | 0.0 /100 | #322 | Tragic 14.1% |
| Blacks/African Americans | 0.0 /100 | #323 | Tragic 14.1% |
| Natives/Alaskans | 0.0 /100 | #324 | Tragic 14.1% |
| Navajo | 0.0 /100 | #325 | Tragic 14.2% |
| Comanche | 0.0 /100 | #326 | Tragic 14.2% |
| Ottawa | 0.0 /100 | #327 | Tragic 14.2% |
| Cape Verdeans | 0.0 /100 | #328 | Tragic 14.2% |
| Osage | 0.0 /100 | #329 | Tragic 14.3% |
| Yuman | 0.0 /100 | #330 | Tragic 14.5% |
| Immigrants | Cabo Verde | 0.0 /100 | #331 | Tragic 14.6% |
| Pima | 0.0 /100 | #332 | Tragic 14.8% |
| Immigrants | Azores | 0.0 /100 | #333 | Tragic 14.9% |
Demographics Similar to Estonians by Female Disability
In terms of female disability, the demographic groups most similar to Estonians are Immigrants from Austria (12.0%, a difference of 0.0%), Immigrants from Sudan (11.9%, a difference of 0.17%), Immigrants from Africa (11.9%, a difference of 0.21%), Pakistani (12.0%, a difference of 0.26%), and Nigerian (12.0%, a difference of 0.30%).
| Demographics | Rating | Rank | Female Disability |
| Ecuadorians | 93.4 /100 | #138 | Exceptional 11.9% |
| Immigrants | Hungary | 92.8 /100 | #139 | Exceptional 11.9% |
| Romanians | 91.6 /100 | #140 | Exceptional 11.9% |
| Immigrants | Ecuador | 91.5 /100 | #141 | Exceptional 11.9% |
| Immigrants | Africa | 90.0 /100 | #142 | Excellent 11.9% |
| Immigrants | Sudan | 89.6 /100 | #143 | Excellent 11.9% |
| Immigrants | Austria | 87.9 /100 | #144 | Excellent 12.0% |
| Estonians | 87.8 /100 | #145 | Excellent 12.0% |
| Pakistanis | 84.6 /100 | #146 | Excellent 12.0% |
| Nigerians | 84.0 /100 | #147 | Excellent 12.0% |
| Immigrants | Kenya | 83.1 /100 | #148 | Excellent 12.0% |
| Greeks | 82.0 /100 | #149 | Excellent 12.0% |
| Immigrants | Moldova | 81.4 /100 | #150 | Excellent 12.0% |
| Icelanders | 80.7 /100 | #151 | Excellent 12.0% |
| Immigrants | Scotland | 79.3 /100 | #152 | Good 12.0% |