Dutch West Indian vs Immigrants from Jamaica Female Disability
COMPARE
Dutch West Indian
Immigrants from Jamaica
Female Disability
Female Disability Comparison
Dutch West Indians
Immigrants from Jamaica
15.0%
FEMALE DISABILITY
0.0/ 100
METRIC RATING
338th/ 347
METRIC RANK
12.6%
FEMALE DISABILITY
2.2/ 100
METRIC RATING
245th/ 347
METRIC RANK
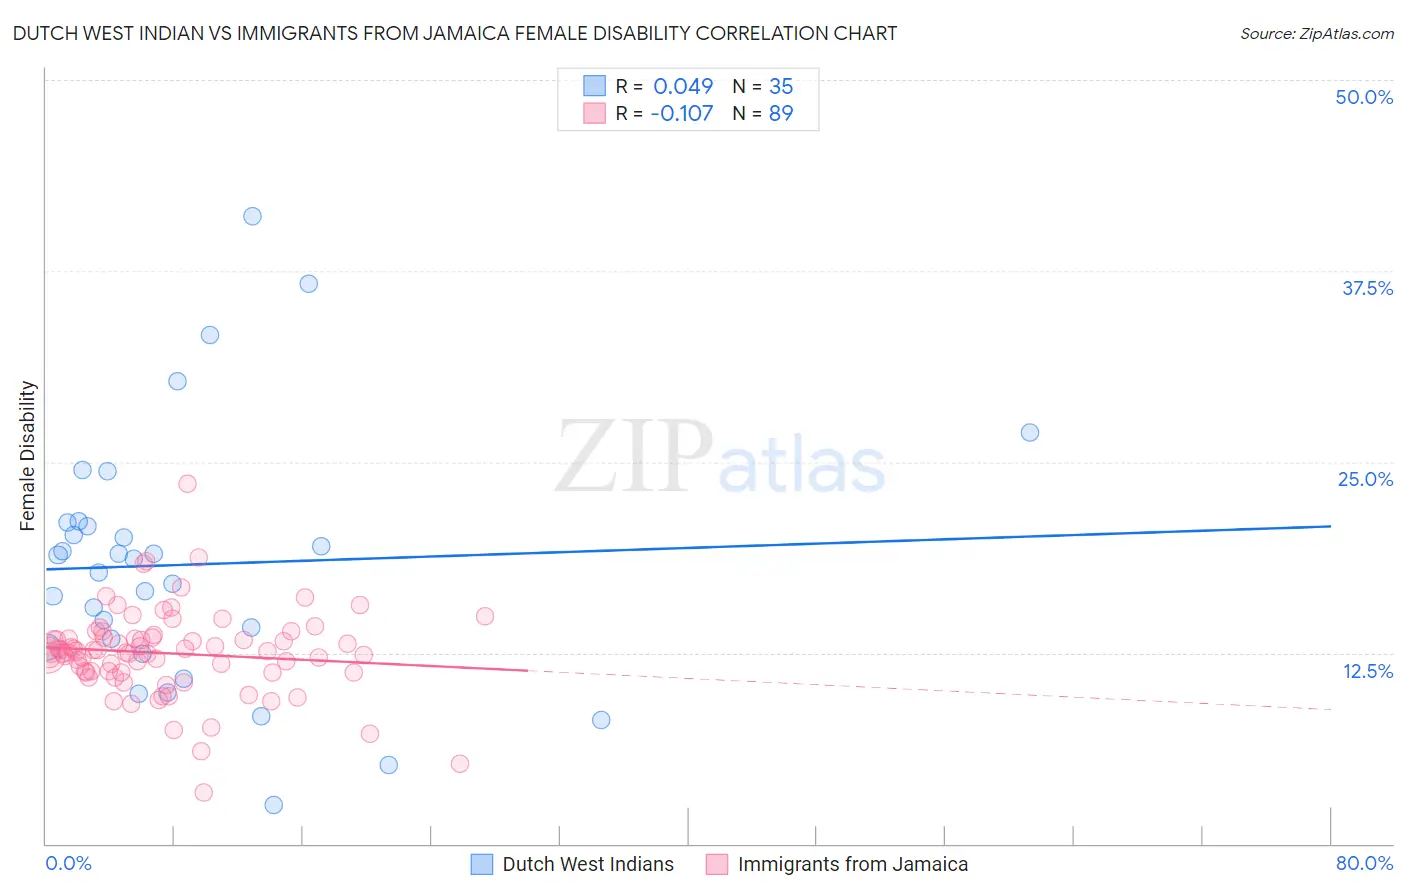
Dutch West Indian vs Immigrants from Jamaica Female Disability Correlation Chart
The statistical analysis conducted on geographies consisting of 85,770,005 people shows no correlation between the proportion of Dutch West Indians and percentage of females with a disability in the United States with a correlation coefficient (R) of 0.049 and weighted average of 15.0%. Similarly, the statistical analysis conducted on geographies consisting of 301,727,948 people shows a poor negative correlation between the proportion of Immigrants from Jamaica and percentage of females with a disability in the United States with a correlation coefficient (R) of -0.107 and weighted average of 12.6%, a difference of 18.8%.
Female Disability Correlation Summary
| Measurement | Dutch West Indian | Immigrants from Jamaica |
| Minimum | 2.6% | 3.3% |
| Maximum | 41.1% | 23.6% |
| Range | 38.5% | 20.2% |
| Mean | 18.3% | 12.5% |
| Median | 18.7% | 12.6% |
| Interquartile 25% (IQ1) | 12.8% | 11.2% |
| Interquartile 75% (IQ3) | 21.0% | 13.5% |
| Interquartile Range (IQR) | 8.2% | 2.3% |
| Standard Deviation (Sample) | 8.3% | 2.9% |
| Standard Deviation (Population) | 8.2% | 2.8% |
Similar Demographics by Female Disability
Demographics Similar to Dutch West Indians by Female Disability
In terms of female disability, the demographic groups most similar to Dutch West Indians are Tohono O'odham (15.0%, a difference of 0.14%), Seminole (15.0%, a difference of 0.26%), Colville (15.1%, a difference of 0.40%), Cajun (14.9%, a difference of 0.94%), and Cherokee (14.9%, a difference of 0.96%).
| Demographics | Rating | Rank | Female Disability |
| Immigrants | Cabo Verde | 0.0 /100 | #331 | Tragic 14.6% |
| Pima | 0.0 /100 | #332 | Tragic 14.8% |
| Immigrants | Azores | 0.0 /100 | #333 | Tragic 14.9% |
| Cherokee | 0.0 /100 | #334 | Tragic 14.9% |
| Cajuns | 0.0 /100 | #335 | Tragic 14.9% |
| Seminole | 0.0 /100 | #336 | Tragic 15.0% |
| Tohono O'odham | 0.0 /100 | #337 | Tragic 15.0% |
| Dutch West Indians | 0.0 /100 | #338 | Tragic 15.0% |
| Colville | 0.0 /100 | #339 | Tragic 15.1% |
| Chickasaw | 0.0 /100 | #340 | Tragic 15.2% |
| Choctaw | 0.0 /100 | #341 | Tragic 15.4% |
| Creek | 0.0 /100 | #342 | Tragic 15.7% |
| Lumbee | 0.0 /100 | #343 | Tragic 15.8% |
| Kiowa | 0.0 /100 | #344 | Tragic 15.8% |
| Puerto Ricans | 0.0 /100 | #345 | Tragic 16.6% |
Demographics Similar to Immigrants from Jamaica by Female Disability
In terms of female disability, the demographic groups most similar to Immigrants from Jamaica are Spanish American Indian (12.6%, a difference of 0.020%), Menominee (12.6%, a difference of 0.030%), Carpatho Rusyn (12.6%, a difference of 0.070%), Alsatian (12.6%, a difference of 0.14%), and Immigrants from Senegal (12.6%, a difference of 0.15%).
| Demographics | Rating | Rank | Female Disability |
| Yugoslavians | 3.7 /100 | #238 | Tragic 12.6% |
| Barbadians | 3.6 /100 | #239 | Tragic 12.6% |
| German Russians | 3.2 /100 | #240 | Tragic 12.6% |
| Japanese | 2.7 /100 | #241 | Tragic 12.6% |
| Canadians | 2.6 /100 | #242 | Tragic 12.6% |
| Immigrants | Senegal | 2.5 /100 | #243 | Tragic 12.6% |
| Alsatians | 2.5 /100 | #244 | Tragic 12.6% |
| Immigrants | Jamaica | 2.2 /100 | #245 | Tragic 12.6% |
| Spanish American Indians | 2.1 /100 | #246 | Tragic 12.6% |
| Menominee | 2.1 /100 | #247 | Tragic 12.6% |
| Carpatho Rusyns | 2.0 /100 | #248 | Tragic 12.6% |
| Immigrants | Congo | 1.8 /100 | #249 | Tragic 12.7% |
| Slovenes | 1.7 /100 | #250 | Tragic 12.7% |
| Crow | 1.6 /100 | #251 | Tragic 12.7% |
| Immigrants | Caribbean | 1.4 /100 | #252 | Tragic 12.7% |