South American vs Immigrants from Spain Vision Disability
COMPARE
South American
Immigrants from Spain
Vision Disability
Vision Disability Comparison
South Americans
Immigrants from Spain
2.1%
VISION DISABILITY
82.8/ 100
METRIC RATING
142nd/ 347
METRIC RANK
2.1%
VISION DISABILITY
89.8/ 100
METRIC RATING
124th/ 347
METRIC RANK
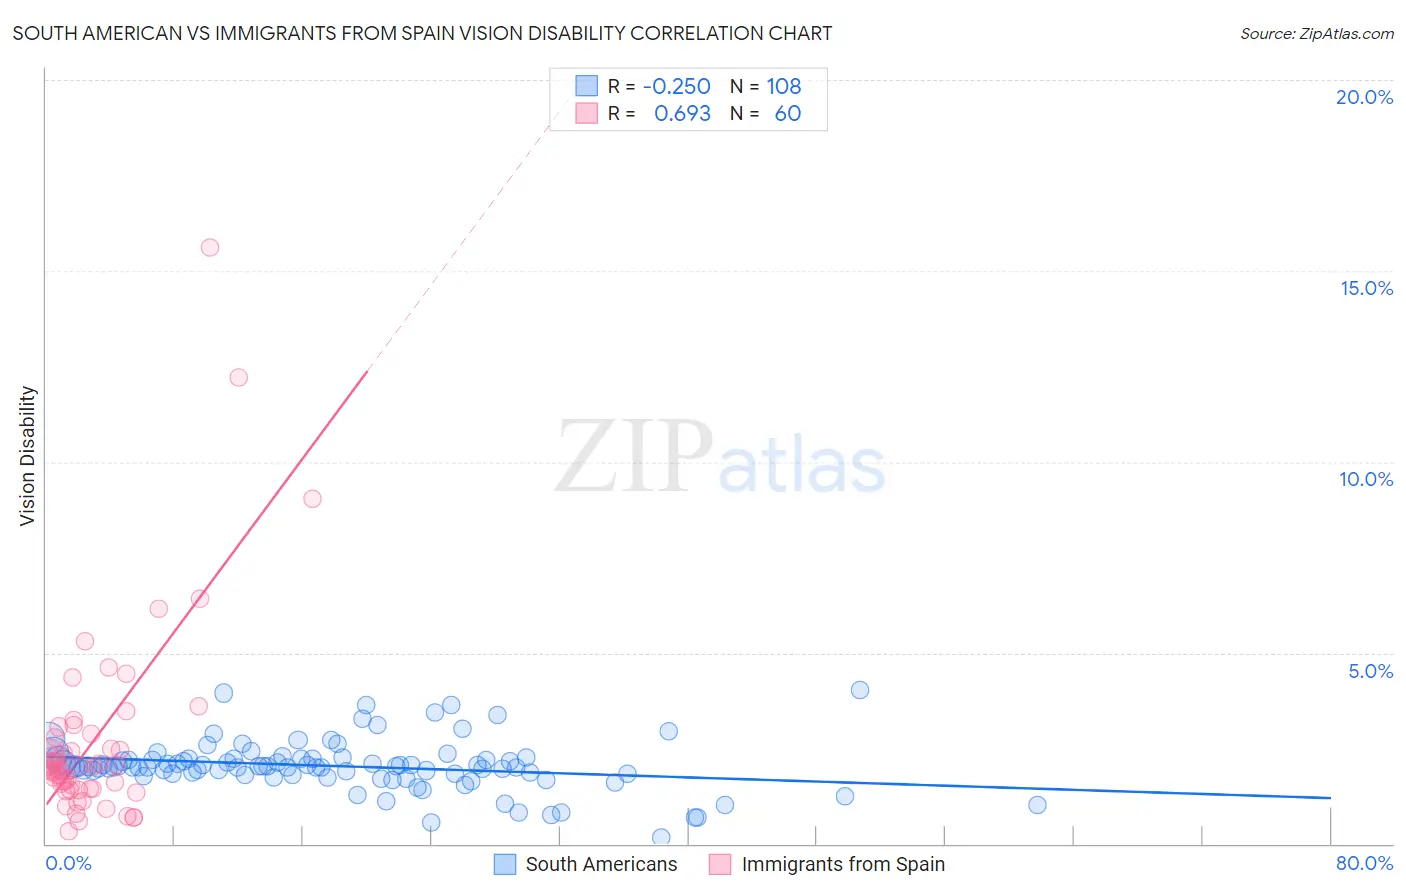
South American vs Immigrants from Spain Vision Disability Correlation Chart
The statistical analysis conducted on geographies consisting of 493,362,805 people shows a weak negative correlation between the proportion of South Americans and percentage of population with vision disability in the United States with a correlation coefficient (R) of -0.250 and weighted average of 2.1%. Similarly, the statistical analysis conducted on geographies consisting of 239,518,838 people shows a significant positive correlation between the proportion of Immigrants from Spain and percentage of population with vision disability in the United States with a correlation coefficient (R) of 0.693 and weighted average of 2.1%, a difference of 0.98%.
Vision Disability Correlation Summary
| Measurement | South American | Immigrants from Spain |
| Minimum | 0.16% | 0.32% |
| Maximum | 4.0% | 15.6% |
| Range | 3.9% | 15.3% |
| Mean | 2.0% | 2.7% |
| Median | 2.0% | 2.0% |
| Interquartile 25% (IQ1) | 1.8% | 1.4% |
| Interquartile 75% (IQ3) | 2.2% | 2.8% |
| Interquartile Range (IQR) | 0.40% | 1.4% |
| Standard Deviation (Sample) | 0.66% | 2.6% |
| Standard Deviation (Population) | 0.66% | 2.6% |
Demographics Similar to South Americans and Immigrants from Spain by Vision Disability
In terms of vision disability, the demographic groups most similar to South Americans are Immigrants from Sierra Leone (2.1%, a difference of 0.0%), Sierra Leonean (2.1%, a difference of 0.15%), Immigrants from Netherlands (2.1%, a difference of 0.16%), Immigrants from Morocco (2.1%, a difference of 0.28%), and Arab (2.1%, a difference of 0.43%). Similarly, the demographic groups most similar to Immigrants from Spain are Immigrants from Venezuela (2.1%, a difference of 0.0%), Immigrants from Peru (2.1%, a difference of 0.040%), Immigrants from Albania (2.1%, a difference of 0.11%), Sudanese (2.1%, a difference of 0.11%), and Immigrants from Chile (2.1%, a difference of 0.14%).
| Demographics | Rating | Rank | Vision Disability |
| Immigrants | Albania | 90.4 /100 | #123 | Exceptional 2.1% |
| Immigrants | Spain | 89.8 /100 | #124 | Excellent 2.1% |
| Immigrants | Venezuela | 89.8 /100 | #125 | Excellent 2.1% |
| Immigrants | Peru | 89.5 /100 | #126 | Excellent 2.1% |
| Sudanese | 89.2 /100 | #127 | Excellent 2.1% |
| Immigrants | Chile | 89.0 /100 | #128 | Excellent 2.1% |
| Immigrants | Cameroon | 88.8 /100 | #129 | Excellent 2.1% |
| Immigrants | Kenya | 88.7 /100 | #130 | Excellent 2.1% |
| Immigrants | Hungary | 88.7 /100 | #131 | Excellent 2.1% |
| New Zealanders | 88.2 /100 | #132 | Excellent 2.1% |
| Syrians | 87.5 /100 | #133 | Excellent 2.1% |
| Venezuelans | 87.2 /100 | #134 | Excellent 2.1% |
| Vietnamese | 86.7 /100 | #135 | Excellent 2.1% |
| Czechs | 86.3 /100 | #136 | Excellent 2.1% |
| Immigrants | South Eastern Asia | 86.3 /100 | #137 | Excellent 2.1% |
| Arabs | 86.3 /100 | #138 | Excellent 2.1% |
| Immigrants | Morocco | 85.2 /100 | #139 | Excellent 2.1% |
| Immigrants | Netherlands | 84.2 /100 | #140 | Excellent 2.1% |
| Sierra Leoneans | 84.1 /100 | #141 | Excellent 2.1% |
| South Americans | 82.8 /100 | #142 | Excellent 2.1% |
| Immigrants | Sierra Leone | 82.8 /100 | #143 | Excellent 2.1% |