Assyrian/Chaldean/Syriac vs Immigrants from Spain Vision Disability
COMPARE
Assyrian/Chaldean/Syriac
Immigrants from Spain
Vision Disability
Vision Disability Comparison
Assyrians/Chaldeans/Syriacs
Immigrants from Spain
2.0%
VISION DISABILITY
98.1/ 100
METRIC RATING
79th/ 347
METRIC RANK
2.1%
VISION DISABILITY
89.8/ 100
METRIC RATING
124th/ 347
METRIC RANK
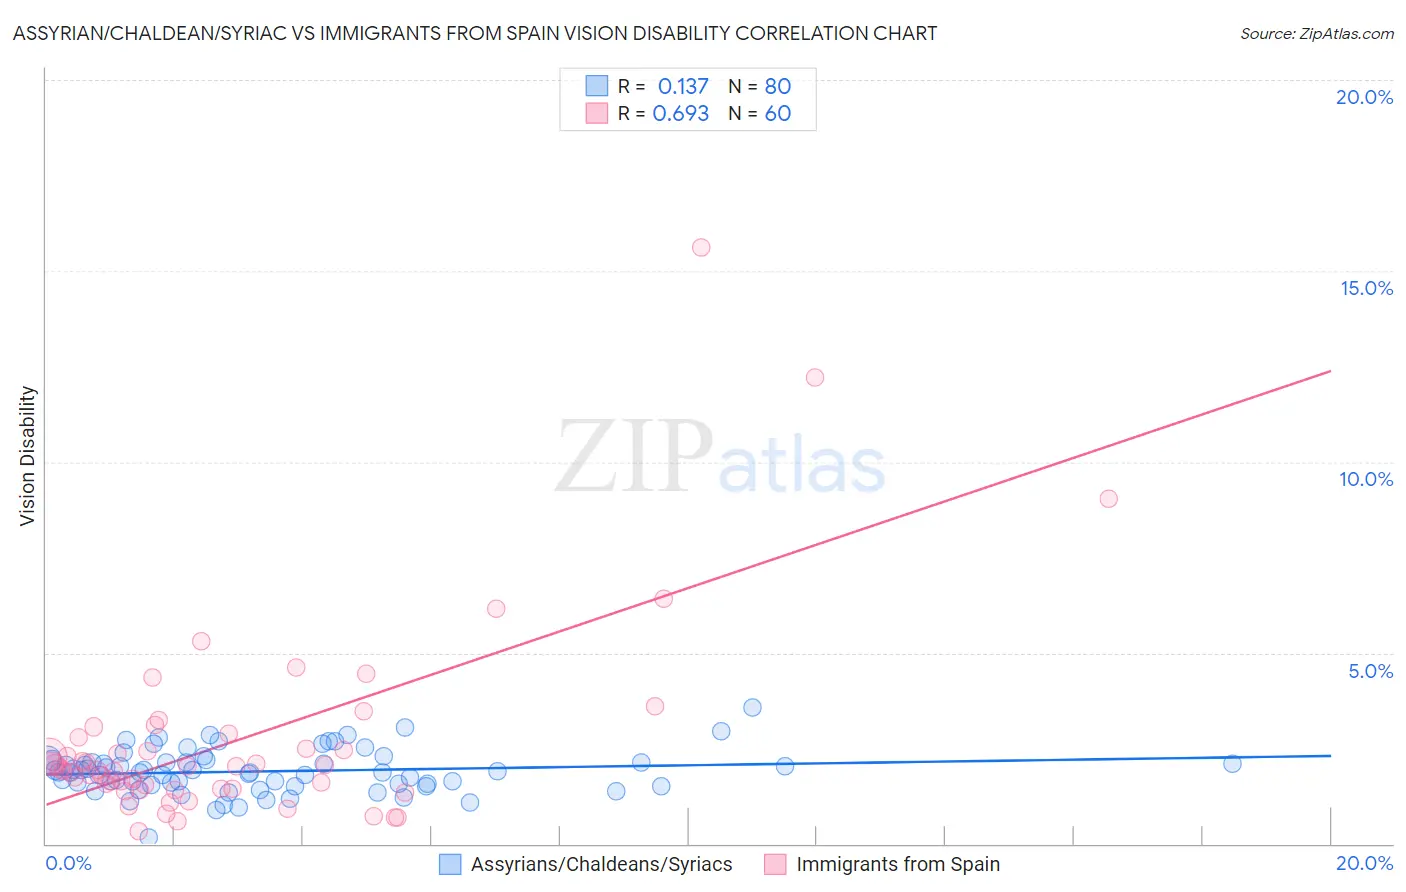
Assyrian/Chaldean/Syriac vs Immigrants from Spain Vision Disability Correlation Chart
The statistical analysis conducted on geographies consisting of 110,300,168 people shows a poor positive correlation between the proportion of Assyrians/Chaldeans/Syriacs and percentage of population with vision disability in the United States with a correlation coefficient (R) of 0.137 and weighted average of 2.0%. Similarly, the statistical analysis conducted on geographies consisting of 239,518,838 people shows a significant positive correlation between the proportion of Immigrants from Spain and percentage of population with vision disability in the United States with a correlation coefficient (R) of 0.693 and weighted average of 2.1%, a difference of 2.9%.
Vision Disability Correlation Summary
| Measurement | Assyrian/Chaldean/Syriac | Immigrants from Spain |
| Minimum | 0.15% | 0.32% |
| Maximum | 3.6% | 15.6% |
| Range | 3.4% | 15.3% |
| Mean | 1.9% | 2.7% |
| Median | 1.9% | 2.0% |
| Interquartile 25% (IQ1) | 1.6% | 1.4% |
| Interquartile 75% (IQ3) | 2.2% | 2.8% |
| Interquartile Range (IQR) | 0.61% | 1.4% |
| Standard Deviation (Sample) | 0.57% | 2.6% |
| Standard Deviation (Population) | 0.56% | 2.6% |
Similar Demographics by Vision Disability
Demographics Similar to Assyrians/Chaldeans/Syriacs by Vision Disability
In terms of vision disability, the demographic groups most similar to Assyrians/Chaldeans/Syriacs are Immigrants from Eastern Europe (2.0%, a difference of 0.18%), Paraguayan (2.0%, a difference of 0.21%), Immigrants from Jordan (2.0%, a difference of 0.21%), Palestinian (2.0%, a difference of 0.23%), and Immigrants from North Macedonia (2.0%, a difference of 0.23%).
| Demographics | Rating | Rank | Vision Disability |
| Immigrants | France | 98.5 /100 | #72 | Exceptional 2.0% |
| Immigrants | Eritrea | 98.4 /100 | #73 | Exceptional 2.0% |
| Palestinians | 98.3 /100 | #74 | Exceptional 2.0% |
| Immigrants | North Macedonia | 98.3 /100 | #75 | Exceptional 2.0% |
| Paraguayans | 98.3 /100 | #76 | Exceptional 2.0% |
| Immigrants | Jordan | 98.3 /100 | #77 | Exceptional 2.0% |
| Immigrants | Eastern Europe | 98.3 /100 | #78 | Exceptional 2.0% |
| Assyrians/Chaldeans/Syriacs | 98.1 /100 | #79 | Exceptional 2.0% |
| Lithuanians | 97.7 /100 | #80 | Exceptional 2.0% |
| Soviet Union | 97.6 /100 | #81 | Exceptional 2.0% |
| Immigrants | Poland | 97.6 /100 | #82 | Exceptional 2.0% |
| Immigrants | Western Asia | 97.5 /100 | #83 | Exceptional 2.0% |
| Immigrants | Latvia | 97.3 /100 | #84 | Exceptional 2.0% |
| Chinese | 97.2 /100 | #85 | Exceptional 2.0% |
| Immigrants | Moldova | 97.2 /100 | #86 | Exceptional 2.0% |
Demographics Similar to Immigrants from Spain by Vision Disability
In terms of vision disability, the demographic groups most similar to Immigrants from Spain are Immigrants from Venezuela (2.1%, a difference of 0.0%), Immigrants from Peru (2.1%, a difference of 0.040%), Immigrants from Scotland (2.1%, a difference of 0.11%), Immigrants from Ukraine (2.1%, a difference of 0.11%), and Immigrants from Albania (2.1%, a difference of 0.11%).
| Demographics | Rating | Rank | Vision Disability |
| Poles | 92.0 /100 | #117 | Exceptional 2.1% |
| Immigrants | Philippines | 91.4 /100 | #118 | Exceptional 2.1% |
| Immigrants | Uganda | 91.4 /100 | #119 | Exceptional 2.1% |
| Immigrants | Zimbabwe | 91.0 /100 | #120 | Exceptional 2.1% |
| Immigrants | Scotland | 90.4 /100 | #121 | Exceptional 2.1% |
| Immigrants | Ukraine | 90.4 /100 | #122 | Exceptional 2.1% |
| Immigrants | Albania | 90.4 /100 | #123 | Exceptional 2.1% |
| Immigrants | Spain | 89.8 /100 | #124 | Excellent 2.1% |
| Immigrants | Venezuela | 89.8 /100 | #125 | Excellent 2.1% |
| Immigrants | Peru | 89.5 /100 | #126 | Excellent 2.1% |
| Sudanese | 89.2 /100 | #127 | Excellent 2.1% |
| Immigrants | Chile | 89.0 /100 | #128 | Excellent 2.1% |
| Immigrants | Cameroon | 88.8 /100 | #129 | Excellent 2.1% |
| Immigrants | Kenya | 88.7 /100 | #130 | Excellent 2.1% |
| Immigrants | Hungary | 88.7 /100 | #131 | Excellent 2.1% |