Belgian vs Blackfeet Self-Care Disability
COMPARE
Belgian
Blackfeet
Self-Care Disability
Self-Care Disability Comparison
Belgians
Blackfeet
2.4%
SELF-CARE DISABILITY
90.9/ 100
METRIC RATING
122nd/ 347
METRIC RANK
2.7%
SELF-CARE DISABILITY
0.0/ 100
METRIC RATING
294th/ 347
METRIC RANK
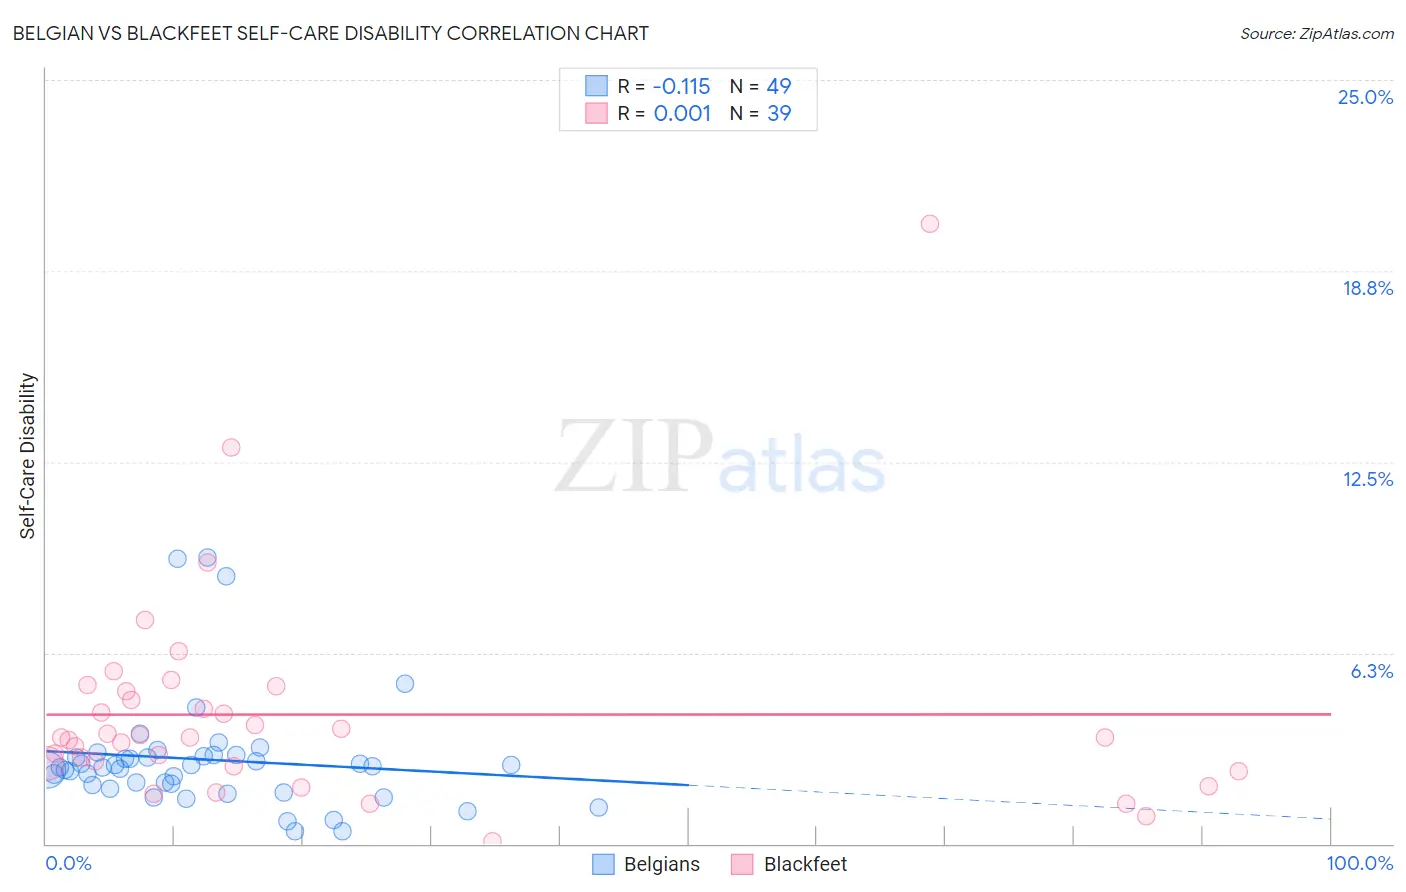
Belgian vs Blackfeet Self-Care Disability Correlation Chart
The statistical analysis conducted on geographies consisting of 355,581,666 people shows a poor negative correlation between the proportion of Belgians and percentage of population with self-care disability in the United States with a correlation coefficient (R) of -0.115 and weighted average of 2.4%. Similarly, the statistical analysis conducted on geographies consisting of 309,304,153 people shows no correlation between the proportion of Blackfeet and percentage of population with self-care disability in the United States with a correlation coefficient (R) of 0.001 and weighted average of 2.7%, a difference of 14.3%.
Self-Care Disability Correlation Summary
| Measurement | Belgian | Blackfeet |
| Minimum | 0.39% | 0.092% |
| Maximum | 9.4% | 20.3% |
| Range | 9.0% | 20.2% |
| Mean | 2.8% | 4.2% |
| Median | 2.5% | 3.5% |
| Interquartile 25% (IQ1) | 1.9% | 2.5% |
| Interquartile 75% (IQ3) | 2.9% | 5.0% |
| Interquartile Range (IQR) | 1.0% | 2.5% |
| Standard Deviation (Sample) | 1.9% | 3.5% |
| Standard Deviation (Population) | 1.9% | 3.5% |
Similar Demographics by Self-Care Disability
Demographics Similar to Belgians by Self-Care Disability
In terms of self-care disability, the demographic groups most similar to Belgians are Peruvian (2.4%, a difference of 0.070%), Immigrants from Nigeria (2.4%, a difference of 0.080%), Immigrants from North America (2.4%, a difference of 0.090%), Immigrants from Morocco (2.4%, a difference of 0.090%), and Uruguayan (2.4%, a difference of 0.10%).
| Demographics | Rating | Rank | Self-Care Disability |
| Immigrants | Hong Kong | 93.1 /100 | #115 | Exceptional 2.4% |
| Northern Europeans | 92.9 /100 | #116 | Exceptional 2.4% |
| Taiwanese | 92.5 /100 | #117 | Exceptional 2.4% |
| Immigrants | Canada | 92.0 /100 | #118 | Exceptional 2.4% |
| Immigrants | Sierra Leone | 91.8 /100 | #119 | Exceptional 2.4% |
| Uruguayans | 91.5 /100 | #120 | Exceptional 2.4% |
| Peruvians | 91.3 /100 | #121 | Exceptional 2.4% |
| Belgians | 90.9 /100 | #122 | Exceptional 2.4% |
| Immigrants | Nigeria | 90.3 /100 | #123 | Exceptional 2.4% |
| Immigrants | North America | 90.2 /100 | #124 | Exceptional 2.4% |
| Immigrants | Morocco | 90.2 /100 | #124 | Exceptional 2.4% |
| Hmong | 89.9 /100 | #126 | Excellent 2.4% |
| Colombians | 89.7 /100 | #127 | Excellent 2.4% |
| Immigrants | Hungary | 89.6 /100 | #128 | Excellent 2.4% |
| Immigrants | Romania | 89.3 /100 | #129 | Excellent 2.4% |
Demographics Similar to Blackfeet by Self-Care Disability
In terms of self-care disability, the demographic groups most similar to Blackfeet are Central American Indian (2.7%, a difference of 0.010%), Belizean (2.7%, a difference of 0.010%), Barbadian (2.7%, a difference of 0.14%), Guyanese (2.7%, a difference of 0.16%), and Cuban (2.7%, a difference of 0.43%).
| Demographics | Rating | Rank | Self-Care Disability |
| Immigrants | Jamaica | 0.0 /100 | #287 | Tragic 2.7% |
| Immigrants | Barbados | 0.0 /100 | #288 | Tragic 2.7% |
| Africans | 0.0 /100 | #289 | Tragic 2.7% |
| Cubans | 0.0 /100 | #290 | Tragic 2.7% |
| Guyanese | 0.0 /100 | #291 | Tragic 2.7% |
| Central American Indians | 0.0 /100 | #292 | Tragic 2.7% |
| Belizeans | 0.0 /100 | #293 | Tragic 2.7% |
| Blackfeet | 0.0 /100 | #294 | Tragic 2.7% |
| Barbadians | 0.0 /100 | #295 | Tragic 2.7% |
| Immigrants | Portugal | 0.0 /100 | #296 | Tragic 2.8% |
| West Indians | 0.0 /100 | #297 | Tragic 2.8% |
| Americans | 0.0 /100 | #298 | Tragic 2.8% |
| Immigrants | Guyana | 0.0 /100 | #299 | Tragic 2.8% |
| Immigrants | Fiji | 0.0 /100 | #300 | Tragic 2.8% |
| Pima | 0.0 /100 | #301 | Tragic 2.8% |