Delaware vs Uruguayan Hearing Disability
COMPARE
Delaware
Uruguayan
Hearing Disability
Hearing Disability Comparison
Delaware
Uruguayans
3.6%
HEARING DISABILITY
0.0/ 100
METRIC RATING
286th/ 347
METRIC RANK
2.8%
HEARING DISABILITY
95.9/ 100
METRIC RATING
94th/ 347
METRIC RANK
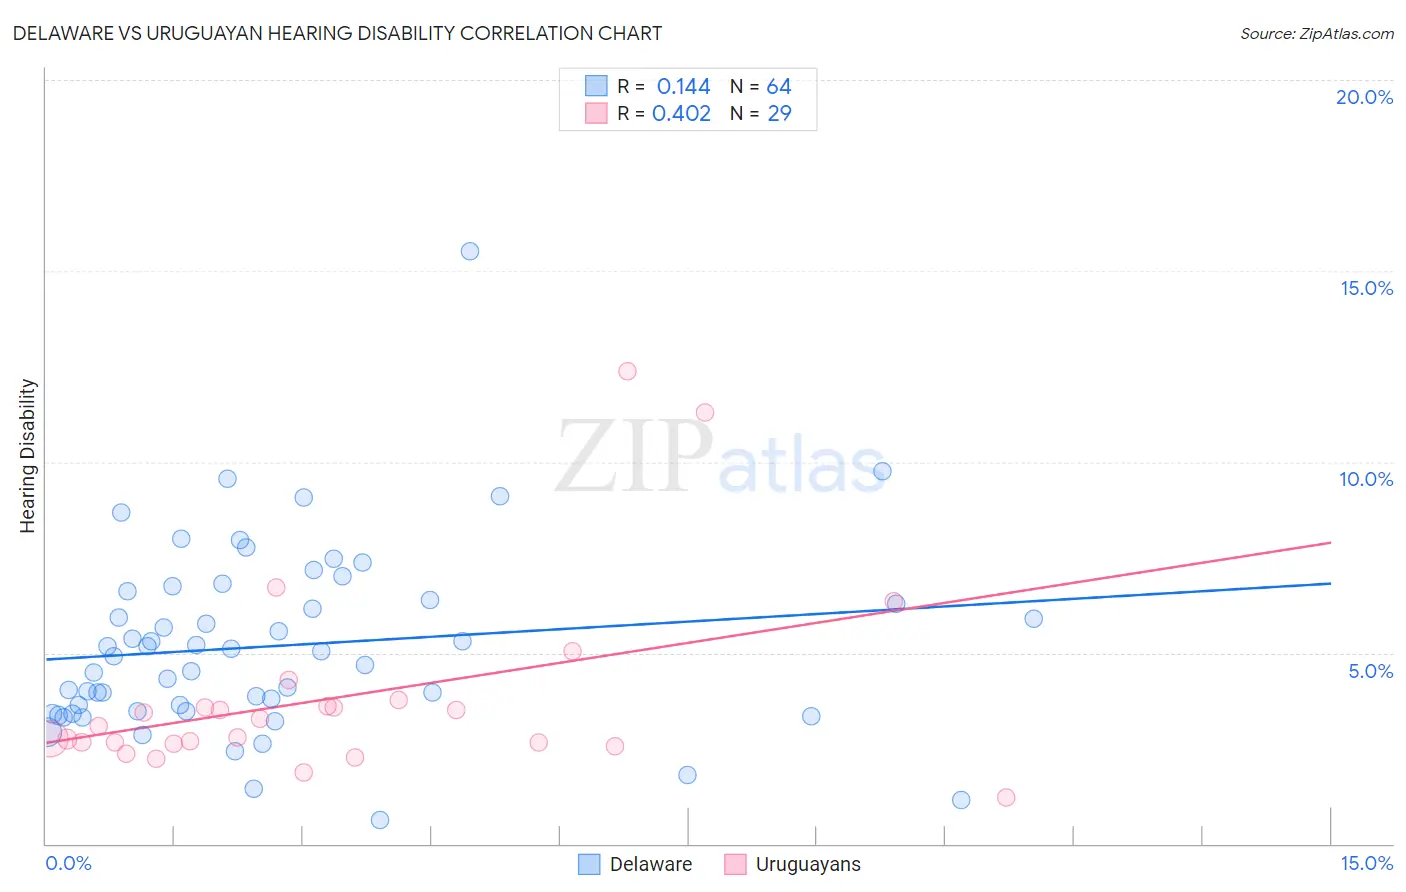
Delaware vs Uruguayan Hearing Disability Correlation Chart
The statistical analysis conducted on geographies consisting of 96,230,255 people shows a poor positive correlation between the proportion of Delaware and percentage of population with hearing disability in the United States with a correlation coefficient (R) of 0.144 and weighted average of 3.6%. Similarly, the statistical analysis conducted on geographies consisting of 144,775,965 people shows a moderate positive correlation between the proportion of Uruguayans and percentage of population with hearing disability in the United States with a correlation coefficient (R) of 0.402 and weighted average of 2.8%, a difference of 31.3%.
Hearing Disability Correlation Summary
| Measurement | Delaware | Uruguayan |
| Minimum | 0.61% | 1.2% |
| Maximum | 15.5% | 12.4% |
| Range | 14.9% | 11.2% |
| Mean | 5.2% | 3.8% |
| Median | 5.0% | 3.1% |
| Interquartile 25% (IQ1) | 3.5% | 2.6% |
| Interquartile 75% (IQ3) | 6.5% | 3.7% |
| Interquartile Range (IQR) | 3.0% | 1.0% |
| Standard Deviation (Sample) | 2.4% | 2.5% |
| Standard Deviation (Population) | 2.4% | 2.5% |
Similar Demographics by Hearing Disability
Demographics Similar to Delaware by Hearing Disability
In terms of hearing disability, the demographic groups most similar to Delaware are Sioux (3.6%, a difference of 0.030%), Immigrants from Micronesia (3.6%, a difference of 0.13%), Spanish (3.7%, a difference of 0.24%), Blackfeet (3.6%, a difference of 0.60%), and Irish (3.7%, a difference of 0.82%).
| Demographics | Rating | Rank | Hearing Disability |
| Slovaks | 0.0 /100 | #279 | Tragic 3.6% |
| French American Indians | 0.0 /100 | #280 | Tragic 3.6% |
| Scandinavians | 0.0 /100 | #281 | Tragic 3.6% |
| Swedes | 0.0 /100 | #282 | Tragic 3.6% |
| Blackfeet | 0.0 /100 | #283 | Tragic 3.6% |
| Immigrants | Micronesia | 0.0 /100 | #284 | Tragic 3.6% |
| Sioux | 0.0 /100 | #285 | Tragic 3.6% |
| Delaware | 0.0 /100 | #286 | Tragic 3.6% |
| Spanish | 0.0 /100 | #287 | Tragic 3.7% |
| Irish | 0.0 /100 | #288 | Tragic 3.7% |
| Chinese | 0.0 /100 | #289 | Tragic 3.7% |
| Whites/Caucasians | 0.0 /100 | #290 | Tragic 3.7% |
| Finns | 0.0 /100 | #291 | Tragic 3.7% |
| Native Hawaiians | 0.0 /100 | #292 | Tragic 3.7% |
| Norwegians | 0.0 /100 | #293 | Tragic 3.7% |
Demographics Similar to Uruguayans by Hearing Disability
In terms of hearing disability, the demographic groups most similar to Uruguayans are Israeli (2.8%, a difference of 0.020%), Immigrants from Somalia (2.8%, a difference of 0.21%), Immigrants from Kuwait (2.8%, a difference of 0.27%), Immigrants from Afghanistan (2.8%, a difference of 0.38%), and Iranian (2.8%, a difference of 0.39%).
| Demographics | Rating | Rank | Hearing Disability |
| Somalis | 96.7 /100 | #87 | Exceptional 2.8% |
| Immigrants | Turkey | 96.7 /100 | #88 | Exceptional 2.8% |
| Belizeans | 96.6 /100 | #89 | Exceptional 2.8% |
| Immigrants | Morocco | 96.6 /100 | #90 | Exceptional 2.8% |
| Immigrants | Middle Africa | 96.5 /100 | #91 | Exceptional 2.8% |
| Iranians | 96.4 /100 | #92 | Exceptional 2.8% |
| Immigrants | Kuwait | 96.3 /100 | #93 | Exceptional 2.8% |
| Uruguayans | 95.9 /100 | #94 | Exceptional 2.8% |
| Israelis | 95.9 /100 | #95 | Exceptional 2.8% |
| Immigrants | Somalia | 95.5 /100 | #96 | Exceptional 2.8% |
| Immigrants | Afghanistan | 95.3 /100 | #97 | Exceptional 2.8% |
| Immigrants | Honduras | 95.1 /100 | #98 | Exceptional 2.8% |
| Immigrants | Guatemala | 95.1 /100 | #99 | Exceptional 2.8% |
| Immigrants | Eastern Africa | 95.0 /100 | #100 | Exceptional 2.8% |
| Immigrants | Spain | 94.9 /100 | #101 | Exceptional 2.8% |