Delaware vs Immigrants from Europe Hearing Disability
COMPARE
Delaware
Immigrants from Europe
Hearing Disability
Hearing Disability Comparison
Delaware
Immigrants from Europe
3.6%
HEARING DISABILITY
0.0/ 100
METRIC RATING
286th/ 347
METRIC RANK
3.1%
HEARING DISABILITY
22.9/ 100
METRIC RATING
196th/ 347
METRIC RANK
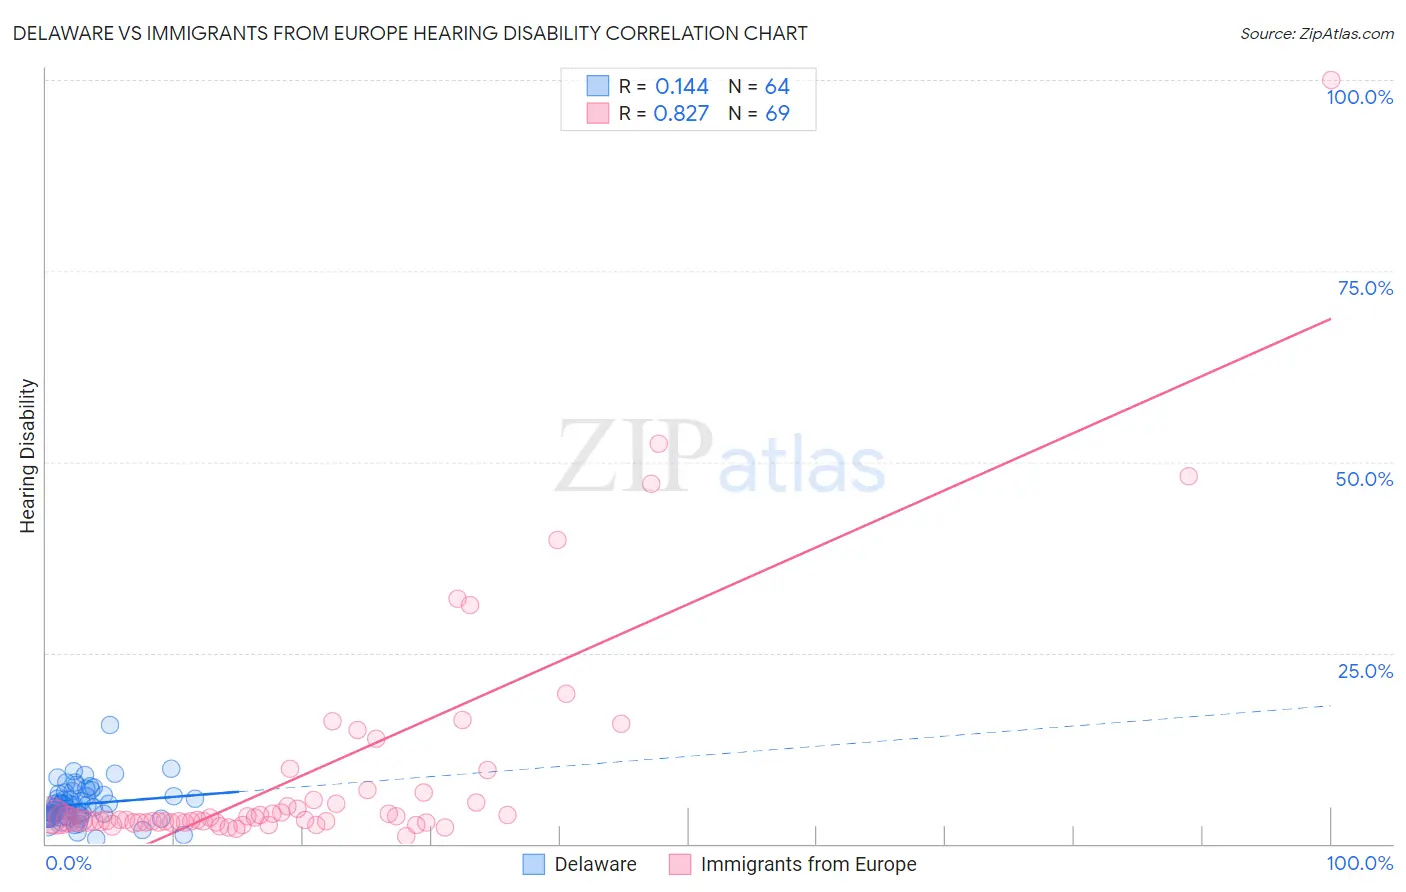
Delaware vs Immigrants from Europe Hearing Disability Correlation Chart
The statistical analysis conducted on geographies consisting of 96,230,255 people shows a poor positive correlation between the proportion of Delaware and percentage of population with hearing disability in the United States with a correlation coefficient (R) of 0.144 and weighted average of 3.6%. Similarly, the statistical analysis conducted on geographies consisting of 546,917,767 people shows a very strong positive correlation between the proportion of Immigrants from Europe and percentage of population with hearing disability in the United States with a correlation coefficient (R) of 0.827 and weighted average of 3.1%, a difference of 18.2%.
Hearing Disability Correlation Summary
| Measurement | Delaware | Immigrants from Europe |
| Minimum | 0.61% | 0.95% |
| Maximum | 15.5% | 100.0% |
| Range | 14.9% | 99.1% |
| Mean | 5.2% | 9.4% |
| Median | 5.0% | 3.2% |
| Interquartile 25% (IQ1) | 3.5% | 2.9% |
| Interquartile 75% (IQ3) | 6.5% | 6.2% |
| Interquartile Range (IQR) | 3.0% | 3.3% |
| Standard Deviation (Sample) | 2.4% | 15.9% |
| Standard Deviation (Population) | 2.4% | 15.8% |
Similar Demographics by Hearing Disability
Demographics Similar to Delaware by Hearing Disability
In terms of hearing disability, the demographic groups most similar to Delaware are Sioux (3.6%, a difference of 0.030%), Immigrants from Micronesia (3.6%, a difference of 0.13%), Spanish (3.7%, a difference of 0.24%), Blackfeet (3.6%, a difference of 0.60%), and Irish (3.7%, a difference of 0.82%).
| Demographics | Rating | Rank | Hearing Disability |
| Slovaks | 0.0 /100 | #279 | Tragic 3.6% |
| French American Indians | 0.0 /100 | #280 | Tragic 3.6% |
| Scandinavians | 0.0 /100 | #281 | Tragic 3.6% |
| Swedes | 0.0 /100 | #282 | Tragic 3.6% |
| Blackfeet | 0.0 /100 | #283 | Tragic 3.6% |
| Immigrants | Micronesia | 0.0 /100 | #284 | Tragic 3.6% |
| Sioux | 0.0 /100 | #285 | Tragic 3.6% |
| Delaware | 0.0 /100 | #286 | Tragic 3.6% |
| Spanish | 0.0 /100 | #287 | Tragic 3.7% |
| Irish | 0.0 /100 | #288 | Tragic 3.7% |
| Chinese | 0.0 /100 | #289 | Tragic 3.7% |
| Whites/Caucasians | 0.0 /100 | #290 | Tragic 3.7% |
| Finns | 0.0 /100 | #291 | Tragic 3.7% |
| Native Hawaiians | 0.0 /100 | #292 | Tragic 3.7% |
| Norwegians | 0.0 /100 | #293 | Tragic 3.7% |
Demographics Similar to Immigrants from Europe by Hearing Disability
In terms of hearing disability, the demographic groups most similar to Immigrants from Europe are Spanish American Indian (3.1%, a difference of 0.16%), South African (3.1%, a difference of 0.21%), Immigrants from Bosnia and Herzegovina (3.1%, a difference of 0.30%), Immigrants from Croatia (3.1%, a difference of 0.32%), and Macedonian (3.1%, a difference of 0.51%).
| Demographics | Rating | Rank | Hearing Disability |
| Africans | 32.9 /100 | #189 | Fair 3.0% |
| Immigrants | South Africa | 31.1 /100 | #190 | Fair 3.1% |
| Immigrants | Switzerland | 28.8 /100 | #191 | Fair 3.1% |
| Koreans | 27.6 /100 | #192 | Fair 3.1% |
| Macedonians | 27.0 /100 | #193 | Fair 3.1% |
| South Africans | 24.5 /100 | #194 | Fair 3.1% |
| Spanish American Indians | 24.1 /100 | #195 | Fair 3.1% |
| Immigrants | Europe | 22.9 /100 | #196 | Fair 3.1% |
| Immigrants | Bosnia and Herzegovina | 20.6 /100 | #197 | Fair 3.1% |
| Immigrants | Croatia | 20.5 /100 | #198 | Fair 3.1% |
| Syrians | 19.2 /100 | #199 | Poor 3.1% |
| Immigrants | North Macedonia | 19.1 /100 | #200 | Poor 3.1% |
| Iraqis | 19.0 /100 | #201 | Poor 3.1% |
| Immigrants | Thailand | 16.4 /100 | #202 | Poor 3.1% |
| Immigrants | Denmark | 16.2 /100 | #203 | Poor 3.1% |