Delaware vs Immigrants from Nigeria Hearing Disability
COMPARE
Delaware
Immigrants from Nigeria
Hearing Disability
Hearing Disability Comparison
Delaware
Immigrants from Nigeria
3.6%
HEARING DISABILITY
0.0/ 100
METRIC RATING
286th/ 347
METRIC RANK
2.6%
HEARING DISABILITY
99.8/ 100
METRIC RATING
23rd/ 347
METRIC RANK
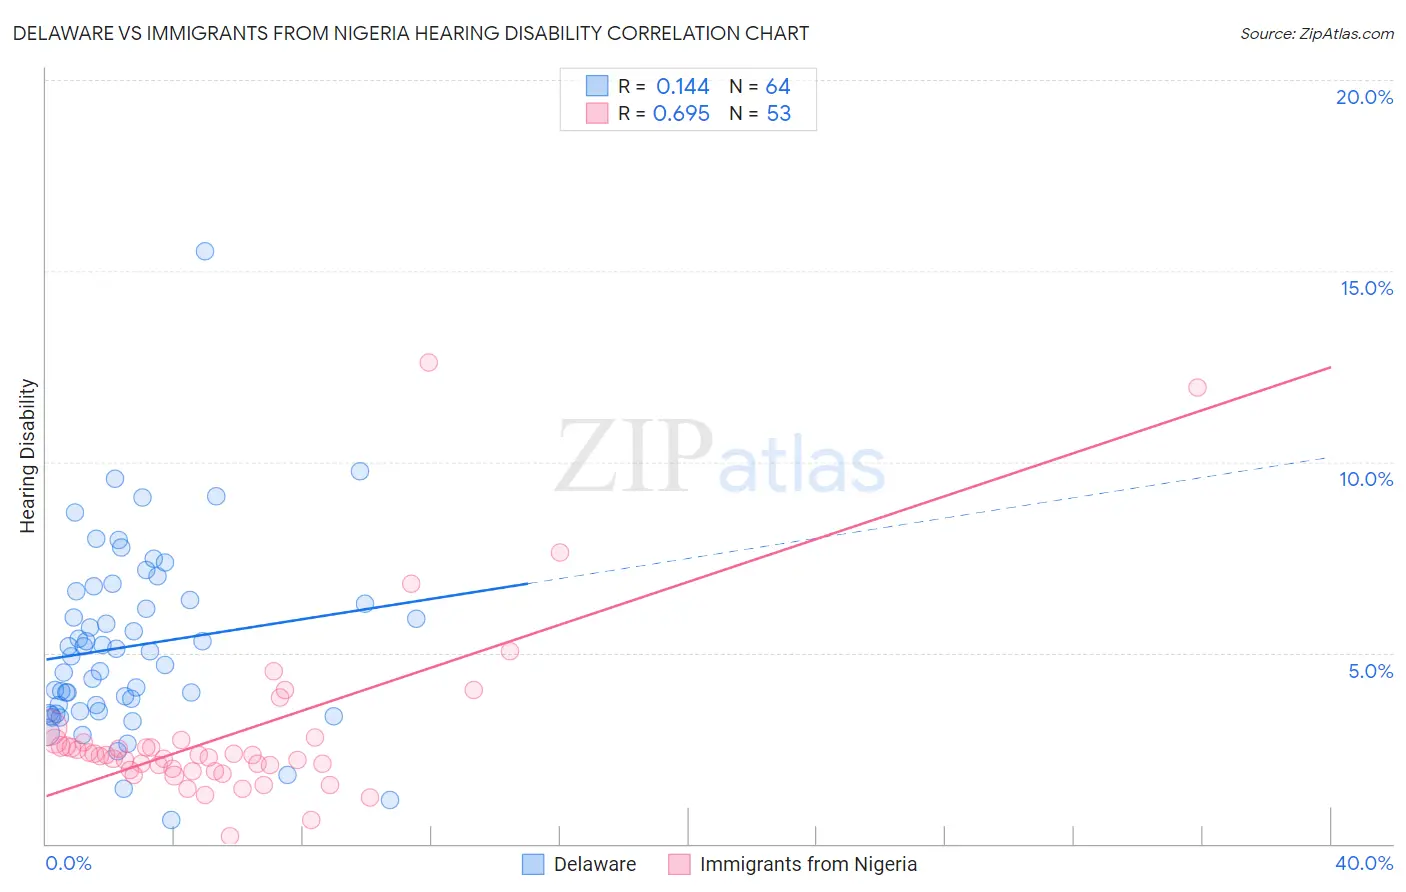
Delaware vs Immigrants from Nigeria Hearing Disability Correlation Chart
The statistical analysis conducted on geographies consisting of 96,230,255 people shows a poor positive correlation between the proportion of Delaware and percentage of population with hearing disability in the United States with a correlation coefficient (R) of 0.144 and weighted average of 3.6%. Similarly, the statistical analysis conducted on geographies consisting of 283,406,904 people shows a significant positive correlation between the proportion of Immigrants from Nigeria and percentage of population with hearing disability in the United States with a correlation coefficient (R) of 0.695 and weighted average of 2.6%, a difference of 42.1%.
Hearing Disability Correlation Summary
| Measurement | Delaware | Immigrants from Nigeria |
| Minimum | 0.61% | 0.19% |
| Maximum | 15.5% | 12.6% |
| Range | 14.9% | 12.4% |
| Mean | 5.2% | 2.9% |
| Median | 5.0% | 2.3% |
| Interquartile 25% (IQ1) | 3.5% | 1.9% |
| Interquartile 75% (IQ3) | 6.5% | 2.7% |
| Interquartile Range (IQR) | 3.0% | 0.75% |
| Standard Deviation (Sample) | 2.4% | 2.3% |
| Standard Deviation (Population) | 2.4% | 2.2% |
Similar Demographics by Hearing Disability
Demographics Similar to Delaware by Hearing Disability
In terms of hearing disability, the demographic groups most similar to Delaware are Sioux (3.6%, a difference of 0.030%), Immigrants from Micronesia (3.6%, a difference of 0.13%), Spanish (3.7%, a difference of 0.24%), Blackfeet (3.6%, a difference of 0.60%), and Irish (3.7%, a difference of 0.82%).
| Demographics | Rating | Rank | Hearing Disability |
| Slovaks | 0.0 /100 | #279 | Tragic 3.6% |
| French American Indians | 0.0 /100 | #280 | Tragic 3.6% |
| Scandinavians | 0.0 /100 | #281 | Tragic 3.6% |
| Swedes | 0.0 /100 | #282 | Tragic 3.6% |
| Blackfeet | 0.0 /100 | #283 | Tragic 3.6% |
| Immigrants | Micronesia | 0.0 /100 | #284 | Tragic 3.6% |
| Sioux | 0.0 /100 | #285 | Tragic 3.6% |
| Delaware | 0.0 /100 | #286 | Tragic 3.6% |
| Spanish | 0.0 /100 | #287 | Tragic 3.7% |
| Irish | 0.0 /100 | #288 | Tragic 3.7% |
| Chinese | 0.0 /100 | #289 | Tragic 3.7% |
| Whites/Caucasians | 0.0 /100 | #290 | Tragic 3.7% |
| Finns | 0.0 /100 | #291 | Tragic 3.7% |
| Native Hawaiians | 0.0 /100 | #292 | Tragic 3.7% |
| Norwegians | 0.0 /100 | #293 | Tragic 3.7% |
Demographics Similar to Immigrants from Nigeria by Hearing Disability
In terms of hearing disability, the demographic groups most similar to Immigrants from Nigeria are Immigrants from Ghana (2.6%, a difference of 0.25%), Immigrants from Sierra Leone (2.6%, a difference of 0.50%), Ghanaian (2.5%, a difference of 0.54%), Immigrants from Bolivia (2.5%, a difference of 0.61%), and Thai (2.5%, a difference of 0.65%).
| Demographics | Rating | Rank | Hearing Disability |
| Immigrants | West Indies | 99.9 /100 | #16 | Exceptional 2.5% |
| Immigrants | India | 99.9 /100 | #17 | Exceptional 2.5% |
| Dominicans | 99.8 /100 | #18 | Exceptional 2.5% |
| Thais | 99.8 /100 | #19 | Exceptional 2.5% |
| Immigrants | Bolivia | 99.8 /100 | #20 | Exceptional 2.5% |
| Ghanaians | 99.8 /100 | #21 | Exceptional 2.5% |
| Immigrants | Sierra Leone | 99.8 /100 | #22 | Exceptional 2.6% |
| Immigrants | Nigeria | 99.8 /100 | #23 | Exceptional 2.6% |
| Immigrants | Ghana | 99.8 /100 | #24 | Exceptional 2.6% |
| Immigrants | El Salvador | 99.7 /100 | #25 | Exceptional 2.6% |
| Immigrants | Senegal | 99.7 /100 | #26 | Exceptional 2.6% |
| Immigrants | South Central Asia | 99.7 /100 | #27 | Exceptional 2.6% |
| Immigrants | Haiti | 99.7 /100 | #28 | Exceptional 2.6% |
| Bolivians | 99.7 /100 | #29 | Exceptional 2.6% |
| Immigrants | Caribbean | 99.7 /100 | #30 | Exceptional 2.6% |