Menominee vs Uruguayan Hearing Disability
COMPARE
Menominee
Uruguayan
Hearing Disability
Hearing Disability Comparison
Menominee
Uruguayans
3.7%
HEARING DISABILITY
0.0/ 100
METRIC RATING
303rd/ 347
METRIC RANK
2.8%
HEARING DISABILITY
95.9/ 100
METRIC RATING
94th/ 347
METRIC RANK
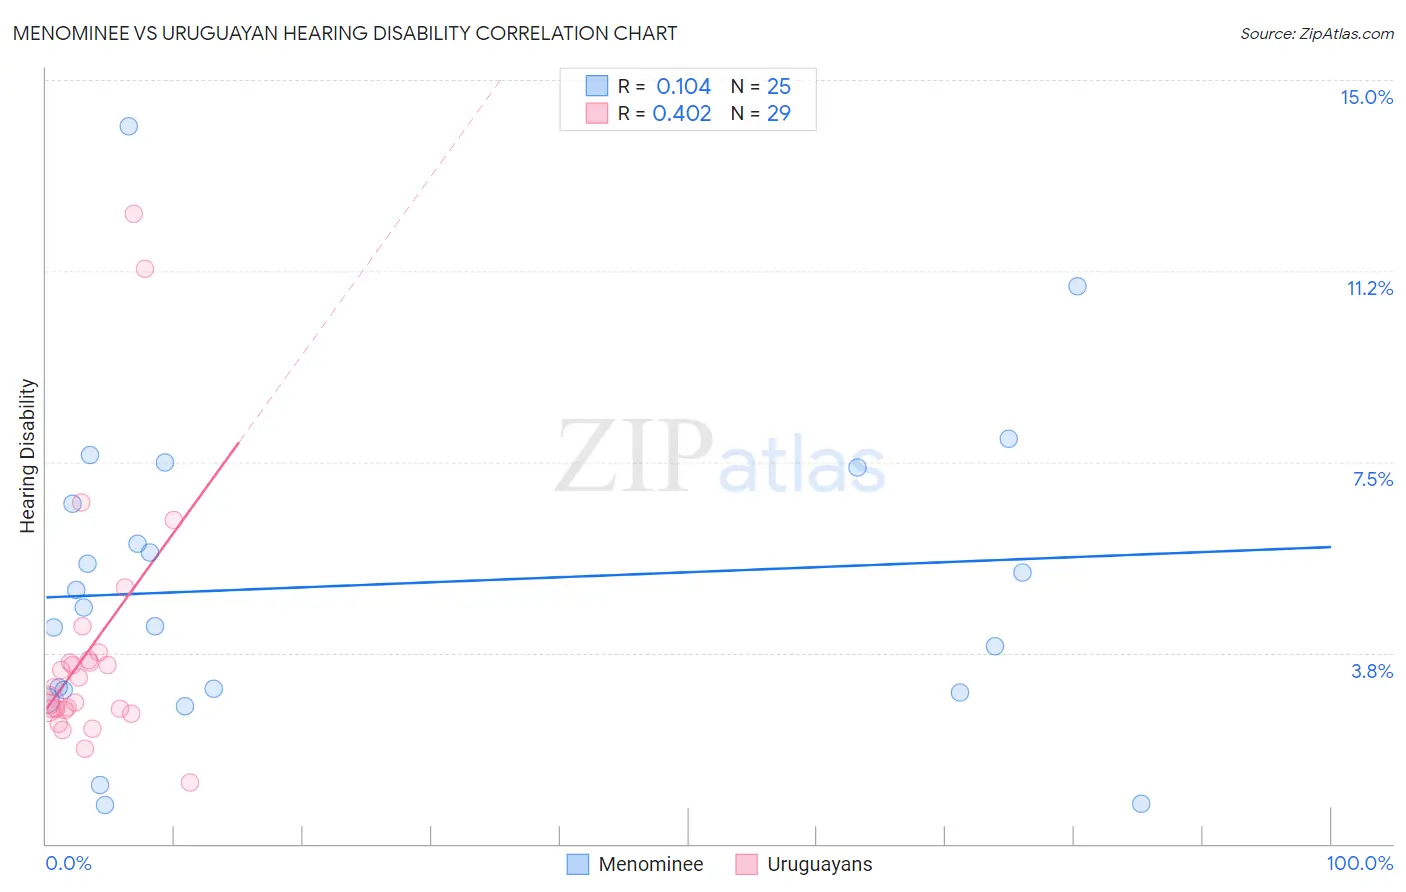
Menominee vs Uruguayan Hearing Disability Correlation Chart
The statistical analysis conducted on geographies consisting of 45,777,415 people shows a poor positive correlation between the proportion of Menominee and percentage of population with hearing disability in the United States with a correlation coefficient (R) of 0.104 and weighted average of 3.7%. Similarly, the statistical analysis conducted on geographies consisting of 144,775,965 people shows a moderate positive correlation between the proportion of Uruguayans and percentage of population with hearing disability in the United States with a correlation coefficient (R) of 0.402 and weighted average of 2.8%, a difference of 34.9%.
Hearing Disability Correlation Summary
| Measurement | Menominee | Uruguayan |
| Minimum | 0.77% | 1.2% |
| Maximum | 14.1% | 12.4% |
| Range | 13.3% | 11.2% |
| Mean | 5.1% | 3.8% |
| Median | 4.6% | 3.1% |
| Interquartile 25% (IQ1) | 3.0% | 2.6% |
| Interquartile 75% (IQ3) | 7.0% | 3.7% |
| Interquartile Range (IQR) | 4.0% | 1.0% |
| Standard Deviation (Sample) | 3.1% | 2.5% |
| Standard Deviation (Population) | 3.0% | 2.5% |
Similar Demographics by Hearing Disability
Demographics Similar to Menominee by Hearing Disability
In terms of hearing disability, the demographic groups most similar to Menominee are Dutch (3.7%, a difference of 0.060%), Pennsylvania German (3.7%, a difference of 0.16%), Scottish (3.7%, a difference of 0.19%), German (3.7%, a difference of 0.25%), and French (3.8%, a difference of 0.30%).
| Demographics | Rating | Rank | Hearing Disability |
| Pima | 0.0 /100 | #296 | Tragic 3.7% |
| Immigrants | Azores | 0.0 /100 | #297 | Tragic 3.7% |
| Celtics | 0.0 /100 | #298 | Tragic 3.7% |
| Germans | 0.0 /100 | #299 | Tragic 3.7% |
| Scottish | 0.0 /100 | #300 | Tragic 3.7% |
| Pennsylvania Germans | 0.0 /100 | #301 | Tragic 3.7% |
| Dutch | 0.0 /100 | #302 | Tragic 3.7% |
| Menominee | 0.0 /100 | #303 | Tragic 3.7% |
| French | 0.0 /100 | #304 | Tragic 3.8% |
| English | 0.0 /100 | #305 | Tragic 3.8% |
| Marshallese | 0.0 /100 | #306 | Tragic 3.8% |
| French Canadians | 0.0 /100 | #307 | Tragic 3.8% |
| Ottawa | 0.0 /100 | #308 | Tragic 3.8% |
| Scotch-Irish | 0.0 /100 | #309 | Tragic 3.8% |
| Cree | 0.0 /100 | #310 | Tragic 3.8% |
Demographics Similar to Uruguayans by Hearing Disability
In terms of hearing disability, the demographic groups most similar to Uruguayans are Israeli (2.8%, a difference of 0.020%), Immigrants from Somalia (2.8%, a difference of 0.21%), Immigrants from Kuwait (2.8%, a difference of 0.27%), Immigrants from Afghanistan (2.8%, a difference of 0.38%), and Iranian (2.8%, a difference of 0.39%).
| Demographics | Rating | Rank | Hearing Disability |
| Somalis | 96.7 /100 | #87 | Exceptional 2.8% |
| Immigrants | Turkey | 96.7 /100 | #88 | Exceptional 2.8% |
| Belizeans | 96.6 /100 | #89 | Exceptional 2.8% |
| Immigrants | Morocco | 96.6 /100 | #90 | Exceptional 2.8% |
| Immigrants | Middle Africa | 96.5 /100 | #91 | Exceptional 2.8% |
| Iranians | 96.4 /100 | #92 | Exceptional 2.8% |
| Immigrants | Kuwait | 96.3 /100 | #93 | Exceptional 2.8% |
| Uruguayans | 95.9 /100 | #94 | Exceptional 2.8% |
| Israelis | 95.9 /100 | #95 | Exceptional 2.8% |
| Immigrants | Somalia | 95.5 /100 | #96 | Exceptional 2.8% |
| Immigrants | Afghanistan | 95.3 /100 | #97 | Exceptional 2.8% |
| Immigrants | Honduras | 95.1 /100 | #98 | Exceptional 2.8% |
| Immigrants | Guatemala | 95.1 /100 | #99 | Exceptional 2.8% |
| Immigrants | Eastern Africa | 95.0 /100 | #100 | Exceptional 2.8% |
| Immigrants | Spain | 94.9 /100 | #101 | Exceptional 2.8% |