Immigrants from Afghanistan vs Uruguayan Hearing Disability
COMPARE
Immigrants from Afghanistan
Uruguayan
Hearing Disability
Hearing Disability Comparison
Immigrants from Afghanistan
Uruguayans
2.8%
HEARING DISABILITY
95.3/ 100
METRIC RATING
97th/ 347
METRIC RANK
2.8%
HEARING DISABILITY
95.9/ 100
METRIC RATING
94th/ 347
METRIC RANK
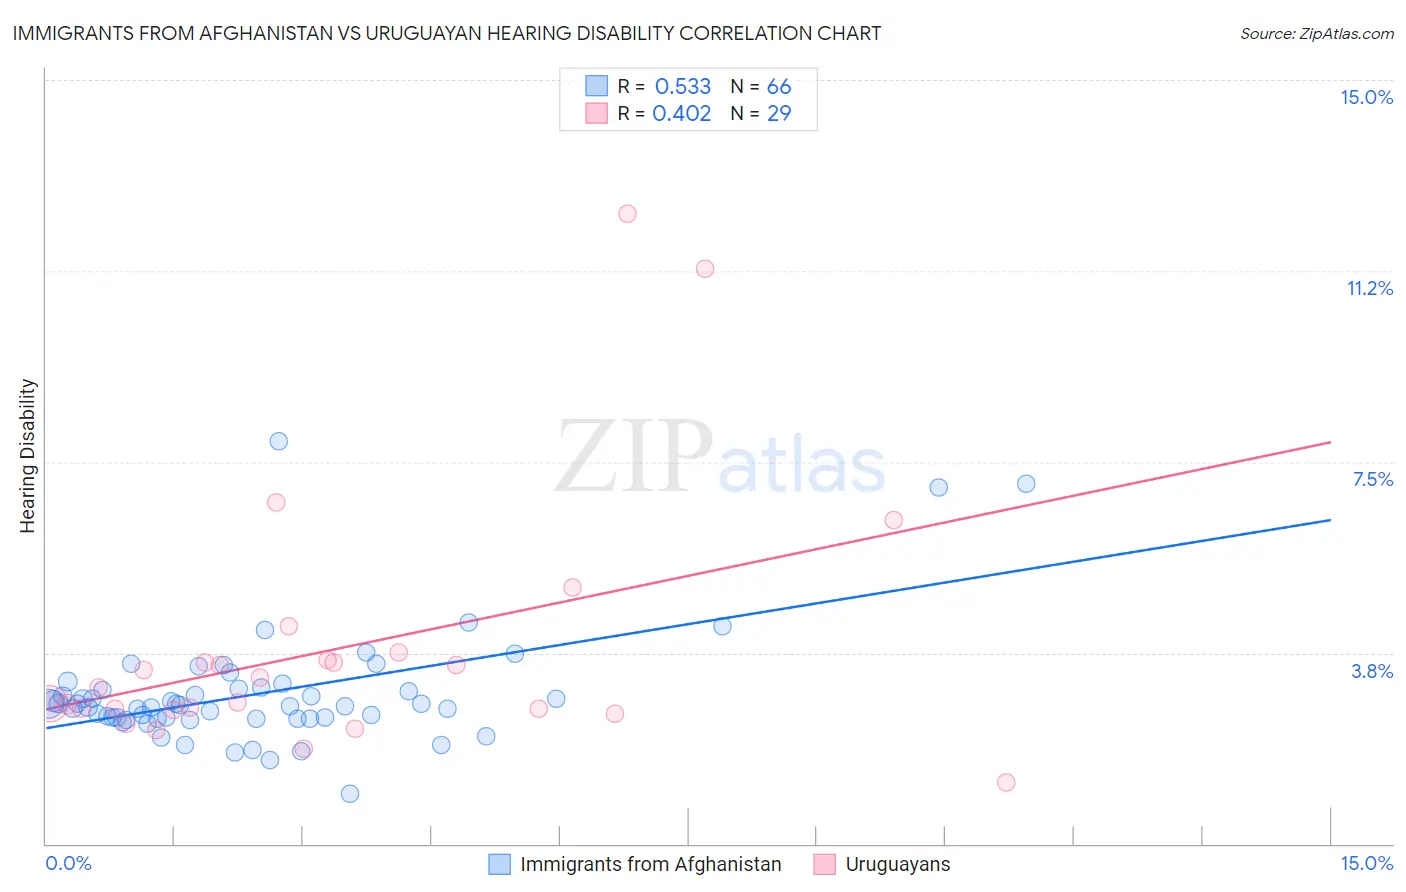
Immigrants from Afghanistan vs Uruguayan Hearing Disability Correlation Chart
The statistical analysis conducted on geographies consisting of 147,605,800 people shows a substantial positive correlation between the proportion of Immigrants from Afghanistan and percentage of population with hearing disability in the United States with a correlation coefficient (R) of 0.533 and weighted average of 2.8%. Similarly, the statistical analysis conducted on geographies consisting of 144,775,965 people shows a moderate positive correlation between the proportion of Uruguayans and percentage of population with hearing disability in the United States with a correlation coefficient (R) of 0.402 and weighted average of 2.8%, a difference of 0.38%.
Hearing Disability Correlation Summary
| Measurement | Immigrants from Afghanistan | Uruguayan |
| Minimum | 0.97% | 1.2% |
| Maximum | 7.9% | 12.4% |
| Range | 6.9% | 11.2% |
| Mean | 2.9% | 3.8% |
| Median | 2.7% | 3.1% |
| Interquartile 25% (IQ1) | 2.5% | 2.6% |
| Interquartile 75% (IQ3) | 3.0% | 3.7% |
| Interquartile Range (IQR) | 0.57% | 1.0% |
| Standard Deviation (Sample) | 1.1% | 2.5% |
| Standard Deviation (Population) | 1.1% | 2.5% |
Demographics Similar to Immigrants from Afghanistan and Uruguayans by Hearing Disability
In terms of hearing disability, the demographic groups most similar to Immigrants from Afghanistan are Immigrants from Honduras (2.8%, a difference of 0.060%), Immigrants from Guatemala (2.8%, a difference of 0.10%), Immigrants from Eastern Africa (2.8%, a difference of 0.15%), Immigrants from Somalia (2.8%, a difference of 0.17%), and Immigrants from Spain (2.8%, a difference of 0.21%). Similarly, the demographic groups most similar to Uruguayans are Israeli (2.8%, a difference of 0.020%), Immigrants from Somalia (2.8%, a difference of 0.21%), Immigrants from Kuwait (2.8%, a difference of 0.27%), Iranian (2.8%, a difference of 0.39%), and Immigrants from Middle Africa (2.8%, a difference of 0.42%).
| Demographics | Rating | Rank | Hearing Disability |
| Immigrants | Northern Africa | 96.9 /100 | #85 | Exceptional 2.8% |
| Immigrants | Iran | 96.8 /100 | #86 | Exceptional 2.8% |
| Somalis | 96.7 /100 | #87 | Exceptional 2.8% |
| Immigrants | Turkey | 96.7 /100 | #88 | Exceptional 2.8% |
| Belizeans | 96.6 /100 | #89 | Exceptional 2.8% |
| Immigrants | Morocco | 96.6 /100 | #90 | Exceptional 2.8% |
| Immigrants | Middle Africa | 96.5 /100 | #91 | Exceptional 2.8% |
| Iranians | 96.4 /100 | #92 | Exceptional 2.8% |
| Immigrants | Kuwait | 96.3 /100 | #93 | Exceptional 2.8% |
| Uruguayans | 95.9 /100 | #94 | Exceptional 2.8% |
| Israelis | 95.9 /100 | #95 | Exceptional 2.8% |
| Immigrants | Somalia | 95.5 /100 | #96 | Exceptional 2.8% |
| Immigrants | Afghanistan | 95.3 /100 | #97 | Exceptional 2.8% |
| Immigrants | Honduras | 95.1 /100 | #98 | Exceptional 2.8% |
| Immigrants | Guatemala | 95.1 /100 | #99 | Exceptional 2.8% |
| Immigrants | Eastern Africa | 95.0 /100 | #100 | Exceptional 2.8% |
| Immigrants | Spain | 94.9 /100 | #101 | Exceptional 2.8% |
| Taiwanese | 94.8 /100 | #102 | Exceptional 2.8% |
| Immigrants | Indonesia | 94.7 /100 | #103 | Exceptional 2.8% |
| Burmese | 94.2 /100 | #104 | Exceptional 2.8% |
| Moroccans | 93.9 /100 | #105 | Exceptional 2.8% |