Delaware vs Uruguayan 1 or more Vehicles in Household
COMPARE
Delaware
Uruguayan
1 or more Vehicles in Household
1 or more Vehicles in Household Comparison
Delaware
Uruguayans
91.0%
1 OR MORE VEHICLES IN HOUSEHOLD
97.6/ 100
METRIC RATING
109th/ 347
METRIC RANK
88.8%
1 OR MORE VEHICLES IN HOUSEHOLD
7.0/ 100
METRIC RATING
222nd/ 347
METRIC RANK
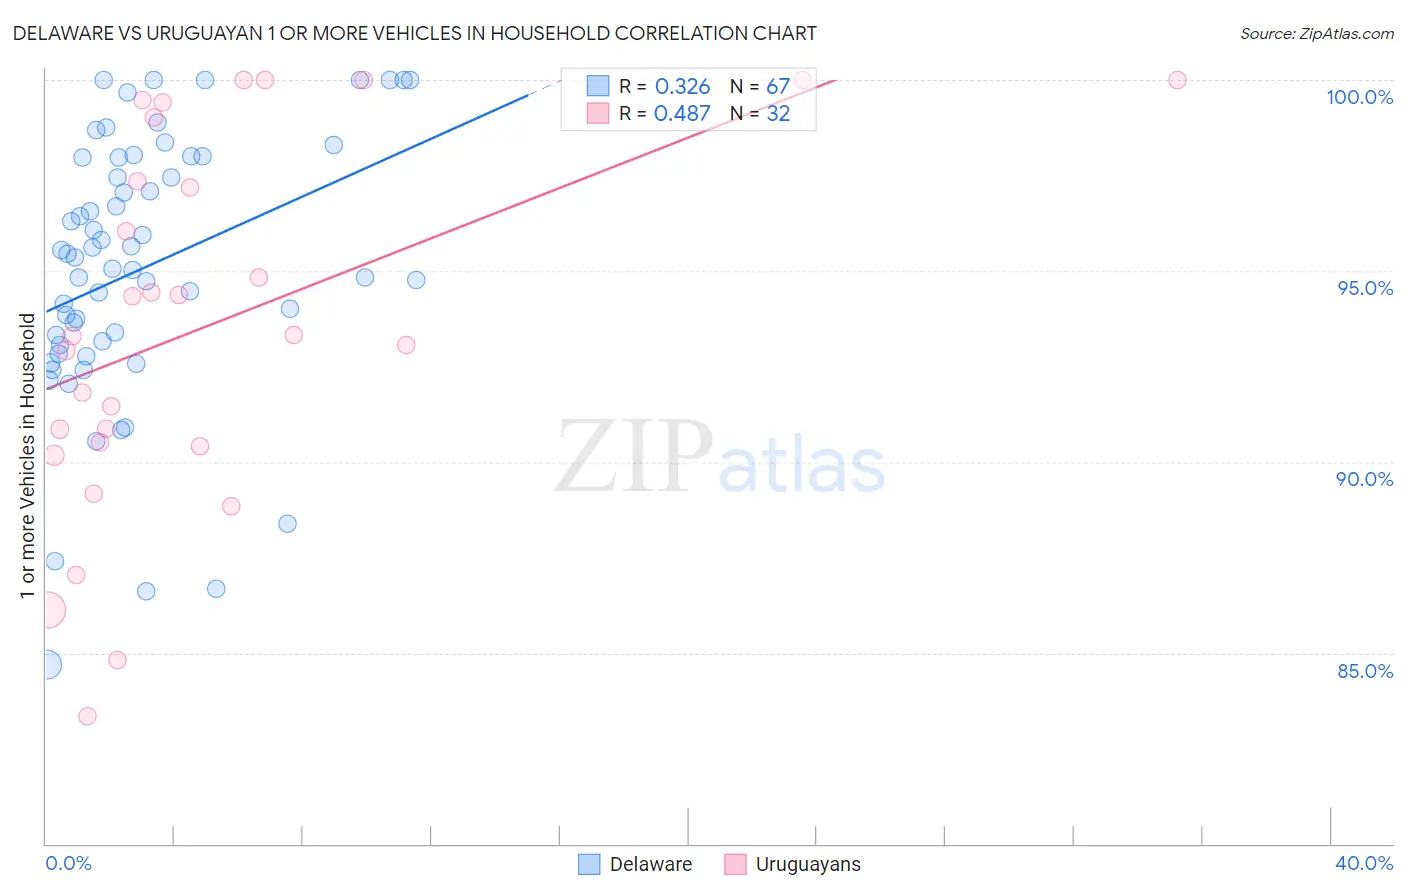
Delaware vs Uruguayan 1 or more Vehicles in Household Correlation Chart
The statistical analysis conducted on geographies consisting of 96,231,317 people shows a mild positive correlation between the proportion of Delaware and percentage of households with 1 or more vehicles available in the United States with a correlation coefficient (R) of 0.326 and weighted average of 91.0%. Similarly, the statistical analysis conducted on geographies consisting of 144,759,773 people shows a moderate positive correlation between the proportion of Uruguayans and percentage of households with 1 or more vehicles available in the United States with a correlation coefficient (R) of 0.487 and weighted average of 88.8%, a difference of 2.5%.
1 or more Vehicles in Household Correlation Summary
| Measurement | Delaware | Uruguayan |
| Minimum | 84.7% | 83.3% |
| Maximum | 100.0% | 100.0% |
| Range | 15.3% | 16.7% |
| Mean | 95.1% | 93.6% |
| Median | 95.4% | 93.3% |
| Interquartile 25% (IQ1) | 93.1% | 90.4% |
| Interquartile 75% (IQ3) | 98.0% | 98.2% |
| Interquartile Range (IQR) | 4.9% | 7.7% |
| Standard Deviation (Sample) | 3.5% | 4.8% |
| Standard Deviation (Population) | 3.5% | 4.7% |
Similar Demographics by 1 or more Vehicles in Household
Demographics Similar to Delaware by 1 or more Vehicles in Household
In terms of 1 or more vehicles in household, the demographic groups most similar to Delaware are Hispanic or Latino (91.0%, a difference of 0.0%), Maltese (91.0%, a difference of 0.010%), Zimbabwean (91.0%, a difference of 0.020%), Mexican American Indian (91.0%, a difference of 0.030%), and Laotian (91.0%, a difference of 0.070%).
| Demographics | Rating | Rank | 1 or more Vehicles in Household |
| Seminole | 98.3 /100 | #102 | Exceptional 91.1% |
| Yugoslavians | 98.3 /100 | #103 | Exceptional 91.1% |
| Asians | 98.2 /100 | #104 | Exceptional 91.1% |
| Laotians | 98.0 /100 | #105 | Exceptional 91.0% |
| Zimbabweans | 97.7 /100 | #106 | Exceptional 91.0% |
| Maltese | 97.7 /100 | #107 | Exceptional 91.0% |
| Hispanics or Latinos | 97.6 /100 | #108 | Exceptional 91.0% |
| Delaware | 97.6 /100 | #109 | Exceptional 91.0% |
| Mexican American Indians | 97.4 /100 | #110 | Exceptional 91.0% |
| Navajo | 95.8 /100 | #111 | Exceptional 90.8% |
| Immigrants | Netherlands | 95.7 /100 | #112 | Exceptional 90.8% |
| Immigrants | Kuwait | 94.7 /100 | #113 | Exceptional 90.7% |
| Armenians | 94.5 /100 | #114 | Exceptional 90.7% |
| Serbians | 94.3 /100 | #115 | Exceptional 90.7% |
| Chippewa | 94.3 /100 | #116 | Exceptional 90.7% |
Demographics Similar to Uruguayans by 1 or more Vehicles in Household
In terms of 1 or more vehicles in household, the demographic groups most similar to Uruguayans are Immigrants from South America (88.8%, a difference of 0.0%), Peruvian (88.8%, a difference of 0.050%), Immigrants from Hong Kong (88.7%, a difference of 0.050%), Cree (88.7%, a difference of 0.060%), and Immigrants from Zaire (88.8%, a difference of 0.070%).
| Demographics | Rating | Rank | 1 or more Vehicles in Household |
| Immigrants | Sri Lanka | 10.2 /100 | #215 | Poor 88.9% |
| Immigrants | Argentina | 9.4 /100 | #216 | Tragic 88.9% |
| Argentineans | 8.8 /100 | #217 | Tragic 88.9% |
| Ugandans | 8.7 /100 | #218 | Tragic 88.9% |
| Immigrants | Guatemala | 8.6 /100 | #219 | Tragic 88.9% |
| Immigrants | Zaire | 8.1 /100 | #220 | Tragic 88.8% |
| Peruvians | 7.9 /100 | #221 | Tragic 88.8% |
| Uruguayans | 7.0 /100 | #222 | Tragic 88.8% |
| Immigrants | South America | 7.0 /100 | #223 | Tragic 88.8% |
| Immigrants | Hong Kong | 6.2 /100 | #224 | Tragic 88.7% |
| Cree | 6.0 /100 | #225 | Tragic 88.7% |
| Cheyenne | 5.7 /100 | #226 | Tragic 88.7% |
| Ute | 5.6 /100 | #227 | Tragic 88.7% |
| Immigrants | Norway | 5.5 /100 | #228 | Tragic 88.7% |
| Immigrants | Romania | 5.4 /100 | #229 | Tragic 88.7% |