Czech vs Uruguayan Hearing Disability
COMPARE
Czech
Uruguayan
Hearing Disability
Hearing Disability Comparison
Czechs
Uruguayans
3.5%
HEARING DISABILITY
0.1/ 100
METRIC RATING
271st/ 347
METRIC RANK
2.8%
HEARING DISABILITY
95.9/ 100
METRIC RATING
94th/ 347
METRIC RANK
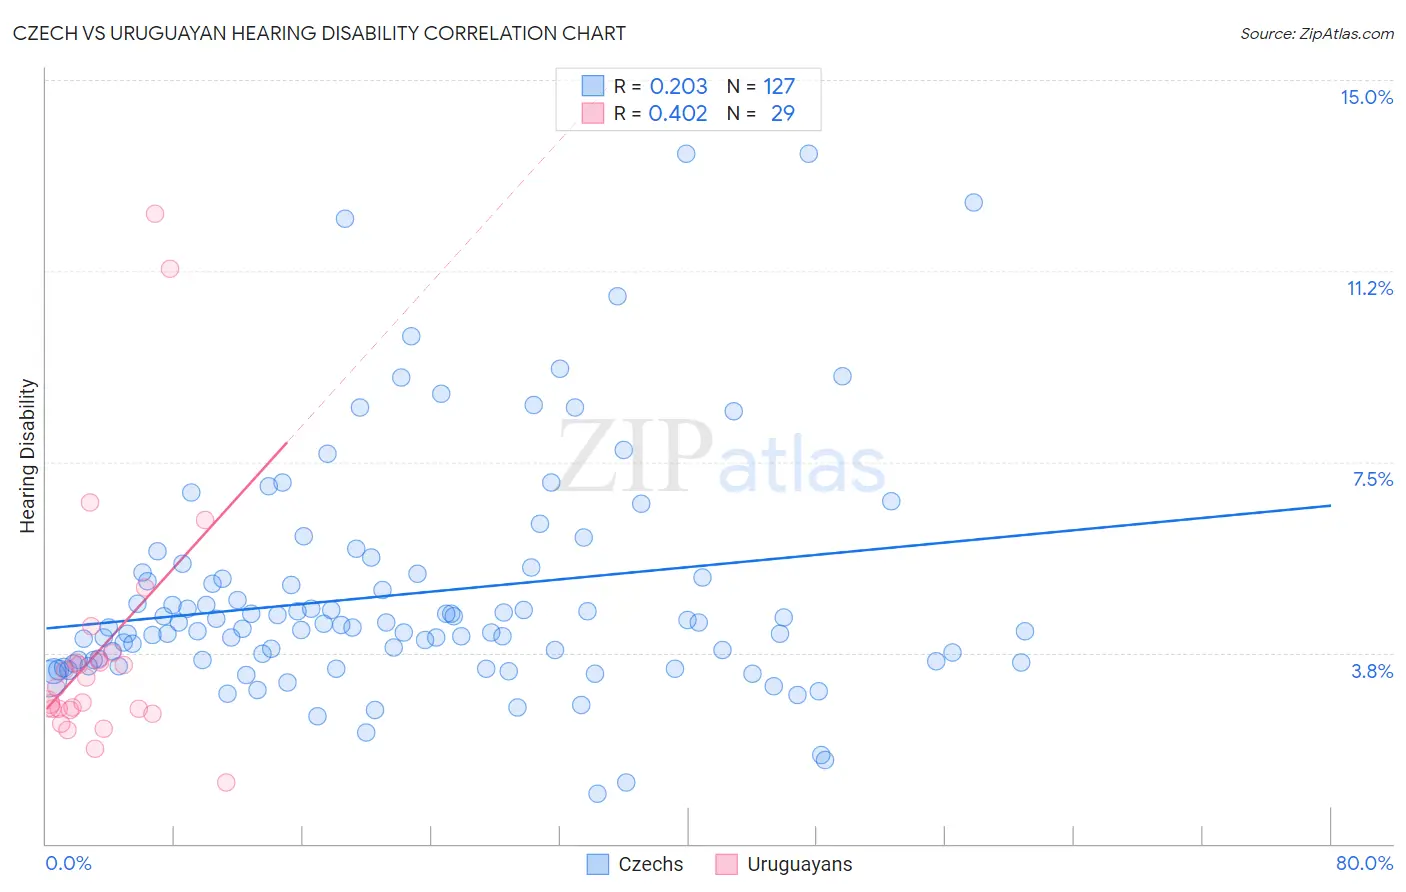
Czech vs Uruguayan Hearing Disability Correlation Chart
The statistical analysis conducted on geographies consisting of 484,559,350 people shows a weak positive correlation between the proportion of Czechs and percentage of population with hearing disability in the United States with a correlation coefficient (R) of 0.203 and weighted average of 3.5%. Similarly, the statistical analysis conducted on geographies consisting of 144,775,965 people shows a moderate positive correlation between the proportion of Uruguayans and percentage of population with hearing disability in the United States with a correlation coefficient (R) of 0.402 and weighted average of 2.8%, a difference of 26.9%.
Hearing Disability Correlation Summary
| Measurement | Czech | Uruguayan |
| Minimum | 0.98% | 1.2% |
| Maximum | 13.6% | 12.4% |
| Range | 12.6% | 11.2% |
| Mean | 4.9% | 3.8% |
| Median | 4.3% | 3.1% |
| Interquartile 25% (IQ1) | 3.6% | 2.6% |
| Interquartile 75% (IQ3) | 5.3% | 3.7% |
| Interquartile Range (IQR) | 1.7% | 1.0% |
| Standard Deviation (Sample) | 2.3% | 2.5% |
| Standard Deviation (Population) | 2.3% | 2.5% |
Similar Demographics by Hearing Disability
Demographics Similar to Czechs by Hearing Disability
In terms of hearing disability, the demographic groups most similar to Czechs are European (3.5%, a difference of 0.26%), Fijian (3.5%, a difference of 0.26%), Puerto Rican (3.5%, a difference of 0.33%), Ute (3.5%, a difference of 0.61%), and Swiss (3.5%, a difference of 0.66%).
| Demographics | Rating | Rank | Hearing Disability |
| Immigrants | Germany | 0.1 /100 | #264 | Tragic 3.5% |
| British | 0.1 /100 | #265 | Tragic 3.5% |
| Belgians | 0.1 /100 | #266 | Tragic 3.5% |
| Canadians | 0.1 /100 | #267 | Tragic 3.5% |
| Spaniards | 0.1 /100 | #268 | Tragic 3.5% |
| Ute | 0.1 /100 | #269 | Tragic 3.5% |
| Europeans | 0.1 /100 | #270 | Tragic 3.5% |
| Czechs | 0.1 /100 | #271 | Tragic 3.5% |
| Fijians | 0.0 /100 | #272 | Tragic 3.5% |
| Puerto Ricans | 0.0 /100 | #273 | Tragic 3.5% |
| Swiss | 0.0 /100 | #274 | Tragic 3.5% |
| Czechoslovakians | 0.0 /100 | #275 | Tragic 3.6% |
| Danes | 0.0 /100 | #276 | Tragic 3.6% |
| Immigrants | Nonimmigrants | 0.0 /100 | #277 | Tragic 3.6% |
| Basques | 0.0 /100 | #278 | Tragic 3.6% |
Demographics Similar to Uruguayans by Hearing Disability
In terms of hearing disability, the demographic groups most similar to Uruguayans are Israeli (2.8%, a difference of 0.020%), Immigrants from Somalia (2.8%, a difference of 0.21%), Immigrants from Kuwait (2.8%, a difference of 0.27%), Immigrants from Afghanistan (2.8%, a difference of 0.38%), and Iranian (2.8%, a difference of 0.39%).
| Demographics | Rating | Rank | Hearing Disability |
| Somalis | 96.7 /100 | #87 | Exceptional 2.8% |
| Immigrants | Turkey | 96.7 /100 | #88 | Exceptional 2.8% |
| Belizeans | 96.6 /100 | #89 | Exceptional 2.8% |
| Immigrants | Morocco | 96.6 /100 | #90 | Exceptional 2.8% |
| Immigrants | Middle Africa | 96.5 /100 | #91 | Exceptional 2.8% |
| Iranians | 96.4 /100 | #92 | Exceptional 2.8% |
| Immigrants | Kuwait | 96.3 /100 | #93 | Exceptional 2.8% |
| Uruguayans | 95.9 /100 | #94 | Exceptional 2.8% |
| Israelis | 95.9 /100 | #95 | Exceptional 2.8% |
| Immigrants | Somalia | 95.5 /100 | #96 | Exceptional 2.8% |
| Immigrants | Afghanistan | 95.3 /100 | #97 | Exceptional 2.8% |
| Immigrants | Honduras | 95.1 /100 | #98 | Exceptional 2.8% |
| Immigrants | Guatemala | 95.1 /100 | #99 | Exceptional 2.8% |
| Immigrants | Eastern Africa | 95.0 /100 | #100 | Exceptional 2.8% |
| Immigrants | Spain | 94.9 /100 | #101 | Exceptional 2.8% |