Delaware vs Immigrants from Cambodia Vision Disability
COMPARE
Delaware
Immigrants from Cambodia
Vision Disability
Vision Disability Comparison
Delaware
Immigrants from Cambodia
2.5%
VISION DISABILITY
0.0/ 100
METRIC RATING
295th/ 347
METRIC RANK
2.3%
VISION DISABILITY
1.1/ 100
METRIC RATING
238th/ 347
METRIC RANK
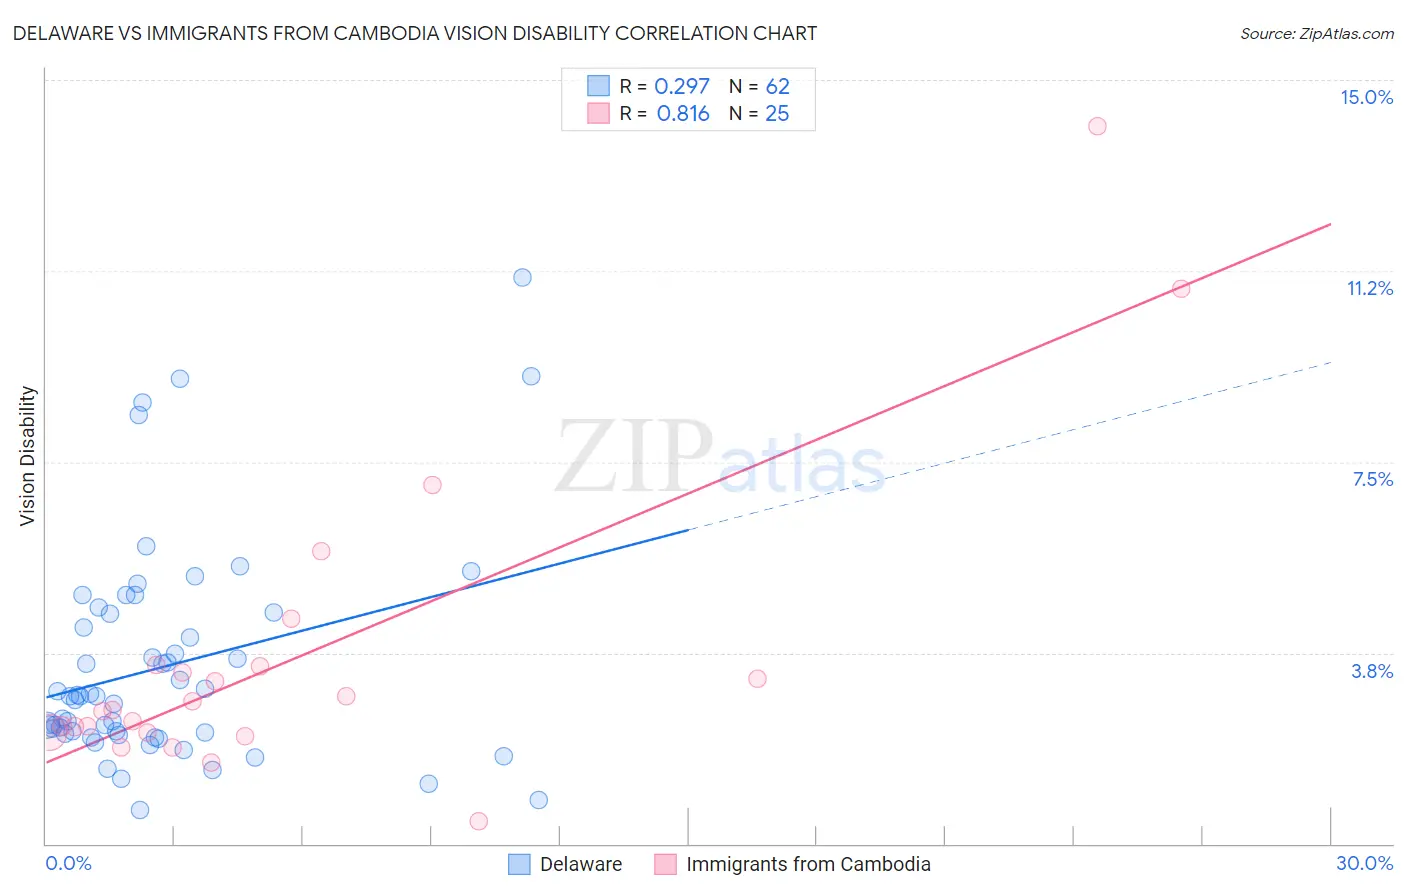
Delaware vs Immigrants from Cambodia Vision Disability Correlation Chart
The statistical analysis conducted on geographies consisting of 96,219,222 people shows a weak positive correlation between the proportion of Delaware and percentage of population with vision disability in the United States with a correlation coefficient (R) of 0.297 and weighted average of 2.5%. Similarly, the statistical analysis conducted on geographies consisting of 205,117,517 people shows a very strong positive correlation between the proportion of Immigrants from Cambodia and percentage of population with vision disability in the United States with a correlation coefficient (R) of 0.816 and weighted average of 2.3%, a difference of 8.2%.
Vision Disability Correlation Summary
| Measurement | Delaware | Immigrants from Cambodia |
| Minimum | 0.66% | 0.43% |
| Maximum | 11.1% | 14.1% |
| Range | 10.5% | 13.7% |
| Mean | 3.5% | 3.7% |
| Median | 2.9% | 2.6% |
| Interquartile 25% (IQ1) | 2.2% | 2.2% |
| Interquartile 75% (IQ3) | 4.5% | 3.5% |
| Interquartile Range (IQR) | 2.3% | 1.3% |
| Standard Deviation (Sample) | 2.1% | 3.0% |
| Standard Deviation (Population) | 2.1% | 2.9% |
Similar Demographics by Vision Disability
Demographics Similar to Delaware by Vision Disability
In terms of vision disability, the demographic groups most similar to Delaware are Immigrants from Mexico (2.5%, a difference of 0.11%), Ottawa (2.5%, a difference of 0.21%), Yaqui (2.5%, a difference of 0.55%), Crow (2.5%, a difference of 0.58%), and Immigrants from Honduras (2.5%, a difference of 0.67%).
| Demographics | Rating | Rank | Vision Disability |
| French American Indians | 0.0 /100 | #288 | Tragic 2.5% |
| Immigrants | Nonimmigrants | 0.0 /100 | #289 | Tragic 2.5% |
| Immigrants | Cuba | 0.0 /100 | #290 | Tragic 2.5% |
| Immigrants | Honduras | 0.0 /100 | #291 | Tragic 2.5% |
| Crow | 0.0 /100 | #292 | Tragic 2.5% |
| Yaqui | 0.0 /100 | #293 | Tragic 2.5% |
| Ottawa | 0.0 /100 | #294 | Tragic 2.5% |
| Delaware | 0.0 /100 | #295 | Tragic 2.5% |
| Immigrants | Mexico | 0.0 /100 | #296 | Tragic 2.5% |
| Immigrants | Dominica | 0.0 /100 | #297 | Tragic 2.5% |
| Mexicans | 0.0 /100 | #298 | Tragic 2.5% |
| Cree | 0.0 /100 | #299 | Tragic 2.5% |
| Africans | 0.0 /100 | #300 | Tragic 2.5% |
| Menominee | 0.0 /100 | #301 | Tragic 2.5% |
| Spanish American Indians | 0.0 /100 | #302 | Tragic 2.6% |
Demographics Similar to Immigrants from Cambodia by Vision Disability
In terms of vision disability, the demographic groups most similar to Immigrants from Cambodia are English (2.3%, a difference of 0.020%), Immigrants from Portugal (2.3%, a difference of 0.27%), Panamanian (2.3%, a difference of 0.27%), Malaysian (2.3%, a difference of 0.30%), and Immigrants from Congo (2.3%, a difference of 0.32%).
| Demographics | Rating | Rank | Vision Disability |
| Immigrants | Ecuador | 2.0 /100 | #231 | Tragic 2.3% |
| German Russians | 1.8 /100 | #232 | Tragic 2.3% |
| Central Americans | 1.8 /100 | #233 | Tragic 2.3% |
| Scottish | 1.6 /100 | #234 | Tragic 2.3% |
| Marshallese | 1.5 /100 | #235 | Tragic 2.3% |
| Immigrants | Congo | 1.4 /100 | #236 | Tragic 2.3% |
| Immigrants | Portugal | 1.4 /100 | #237 | Tragic 2.3% |
| Immigrants | Cambodia | 1.1 /100 | #238 | Tragic 2.3% |
| English | 1.1 /100 | #239 | Tragic 2.3% |
| Panamanians | 0.9 /100 | #240 | Tragic 2.3% |
| Malaysians | 0.9 /100 | #241 | Tragic 2.3% |
| Immigrants | Panama | 0.8 /100 | #242 | Tragic 2.3% |
| Immigrants | Nicaragua | 0.6 /100 | #243 | Tragic 2.3% |
| Immigrants | West Indies | 0.6 /100 | #244 | Tragic 2.3% |
| Alsatians | 0.6 /100 | #245 | Tragic 2.3% |