Delaware vs Immigrants from Trinidad and Tobago Vision Disability
COMPARE
Delaware
Immigrants from Trinidad and Tobago
Vision Disability
Vision Disability Comparison
Delaware
Immigrants from Trinidad and Tobago
2.5%
VISION DISABILITY
0.0/ 100
METRIC RATING
295th/ 347
METRIC RANK
2.3%
VISION DISABILITY
6.1/ 100
METRIC RATING
216th/ 347
METRIC RANK
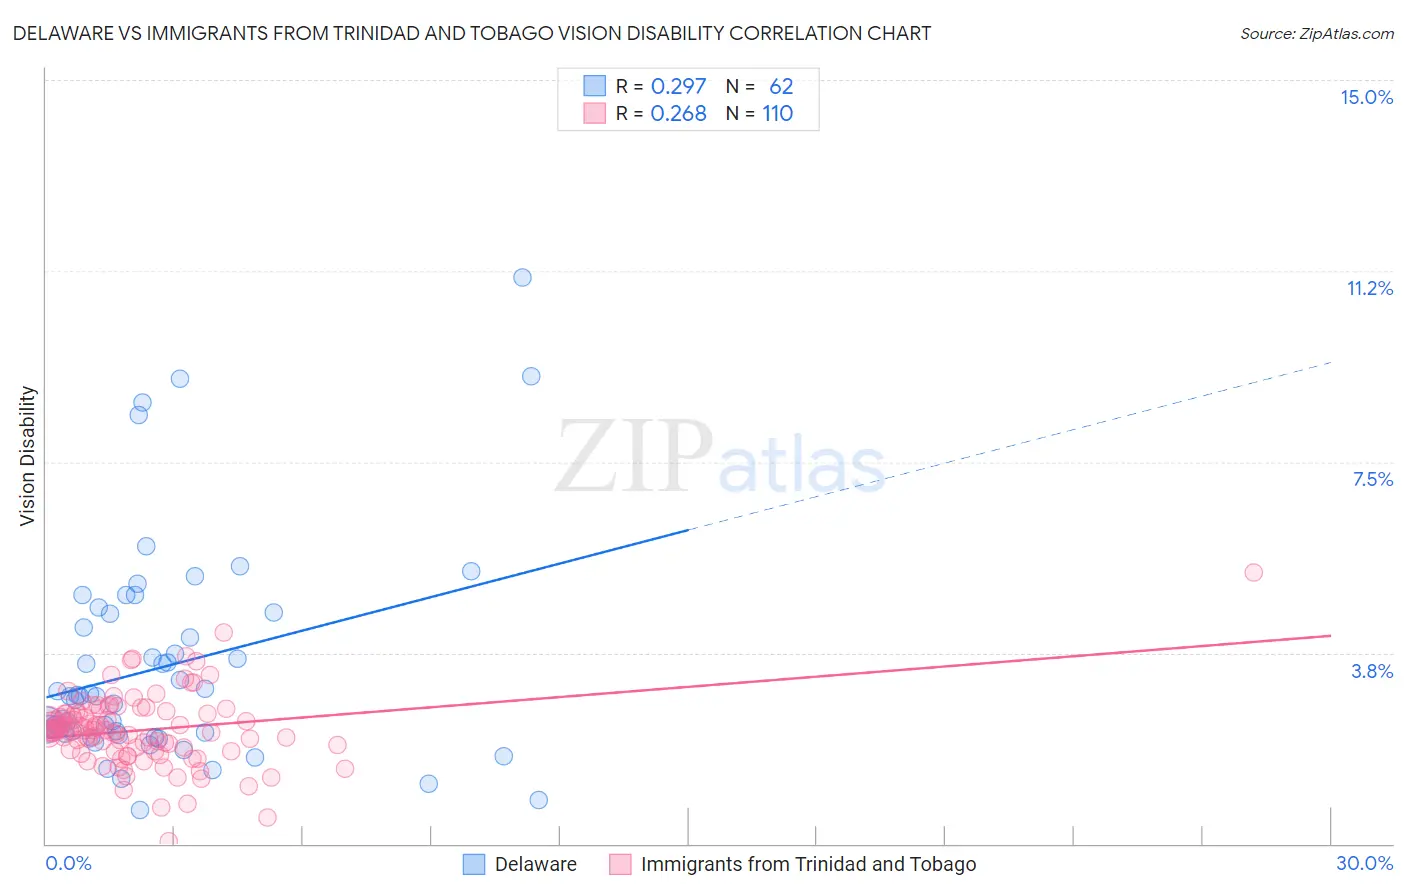
Delaware vs Immigrants from Trinidad and Tobago Vision Disability Correlation Chart
The statistical analysis conducted on geographies consisting of 96,219,222 people shows a weak positive correlation between the proportion of Delaware and percentage of population with vision disability in the United States with a correlation coefficient (R) of 0.297 and weighted average of 2.5%. Similarly, the statistical analysis conducted on geographies consisting of 223,458,050 people shows a weak positive correlation between the proportion of Immigrants from Trinidad and Tobago and percentage of population with vision disability in the United States with a correlation coefficient (R) of 0.268 and weighted average of 2.3%, a difference of 11.1%.
Vision Disability Correlation Summary
| Measurement | Delaware | Immigrants from Trinidad and Tobago |
| Minimum | 0.66% | 0.061% |
| Maximum | 11.1% | 5.3% |
| Range | 10.5% | 5.3% |
| Mean | 3.5% | 2.2% |
| Median | 2.9% | 2.2% |
| Interquartile 25% (IQ1) | 2.2% | 1.8% |
| Interquartile 75% (IQ3) | 4.5% | 2.6% |
| Interquartile Range (IQR) | 2.3% | 0.74% |
| Standard Deviation (Sample) | 2.1% | 0.72% |
| Standard Deviation (Population) | 2.1% | 0.72% |
Similar Demographics by Vision Disability
Demographics Similar to Delaware by Vision Disability
In terms of vision disability, the demographic groups most similar to Delaware are Immigrants from Mexico (2.5%, a difference of 0.11%), Ottawa (2.5%, a difference of 0.21%), Yaqui (2.5%, a difference of 0.55%), Crow (2.5%, a difference of 0.58%), and Immigrants from Honduras (2.5%, a difference of 0.67%).
| Demographics | Rating | Rank | Vision Disability |
| French American Indians | 0.0 /100 | #288 | Tragic 2.5% |
| Immigrants | Nonimmigrants | 0.0 /100 | #289 | Tragic 2.5% |
| Immigrants | Cuba | 0.0 /100 | #290 | Tragic 2.5% |
| Immigrants | Honduras | 0.0 /100 | #291 | Tragic 2.5% |
| Crow | 0.0 /100 | #292 | Tragic 2.5% |
| Yaqui | 0.0 /100 | #293 | Tragic 2.5% |
| Ottawa | 0.0 /100 | #294 | Tragic 2.5% |
| Delaware | 0.0 /100 | #295 | Tragic 2.5% |
| Immigrants | Mexico | 0.0 /100 | #296 | Tragic 2.5% |
| Immigrants | Dominica | 0.0 /100 | #297 | Tragic 2.5% |
| Mexicans | 0.0 /100 | #298 | Tragic 2.5% |
| Cree | 0.0 /100 | #299 | Tragic 2.5% |
| Africans | 0.0 /100 | #300 | Tragic 2.5% |
| Menominee | 0.0 /100 | #301 | Tragic 2.5% |
| Spanish American Indians | 0.0 /100 | #302 | Tragic 2.6% |
Demographics Similar to Immigrants from Trinidad and Tobago by Vision Disability
In terms of vision disability, the demographic groups most similar to Immigrants from Trinidad and Tobago are Barbadian (2.3%, a difference of 0.28%), Nigerian (2.3%, a difference of 0.29%), Portuguese (2.3%, a difference of 0.34%), Ecuadorian (2.3%, a difference of 0.45%), and Trinidadian and Tobagonian (2.2%, a difference of 0.50%).
| Demographics | Rating | Rank | Vision Disability |
| Immigrants | Brazil | 13.1 /100 | #209 | Poor 2.2% |
| Immigrants | Uruguay | 11.5 /100 | #210 | Poor 2.2% |
| Indonesians | 9.5 /100 | #211 | Tragic 2.2% |
| Bermudans | 9.0 /100 | #212 | Tragic 2.2% |
| Immigrants | Ghana | 8.9 /100 | #213 | Tragic 2.2% |
| Trinidadians and Tobagonians | 8.2 /100 | #214 | Tragic 2.2% |
| Nigerians | 7.2 /100 | #215 | Tragic 2.3% |
| Immigrants | Trinidad and Tobago | 6.1 /100 | #216 | Tragic 2.3% |
| Barbadians | 5.1 /100 | #217 | Tragic 2.3% |
| Portuguese | 4.9 /100 | #218 | Tragic 2.3% |
| Ecuadorians | 4.6 /100 | #219 | Tragic 2.3% |
| Guamanians/Chamorros | 3.9 /100 | #220 | Tragic 2.3% |
| French Canadians | 3.9 /100 | #221 | Tragic 2.3% |
| Immigrants | Senegal | 3.8 /100 | #222 | Tragic 2.3% |
| Basques | 3.5 /100 | #223 | Tragic 2.3% |