Delaware vs Immigrants from Austria Male Disability
COMPARE
Delaware
Immigrants from Austria
Male Disability
Male Disability Comparison
Delaware
Immigrants from Austria
13.5%
MALE DISABILITY
0.0/ 100
METRIC RATING
311th/ 347
METRIC RANK
11.4%
MALE DISABILITY
27.3/ 100
METRIC RATING
187th/ 347
METRIC RANK
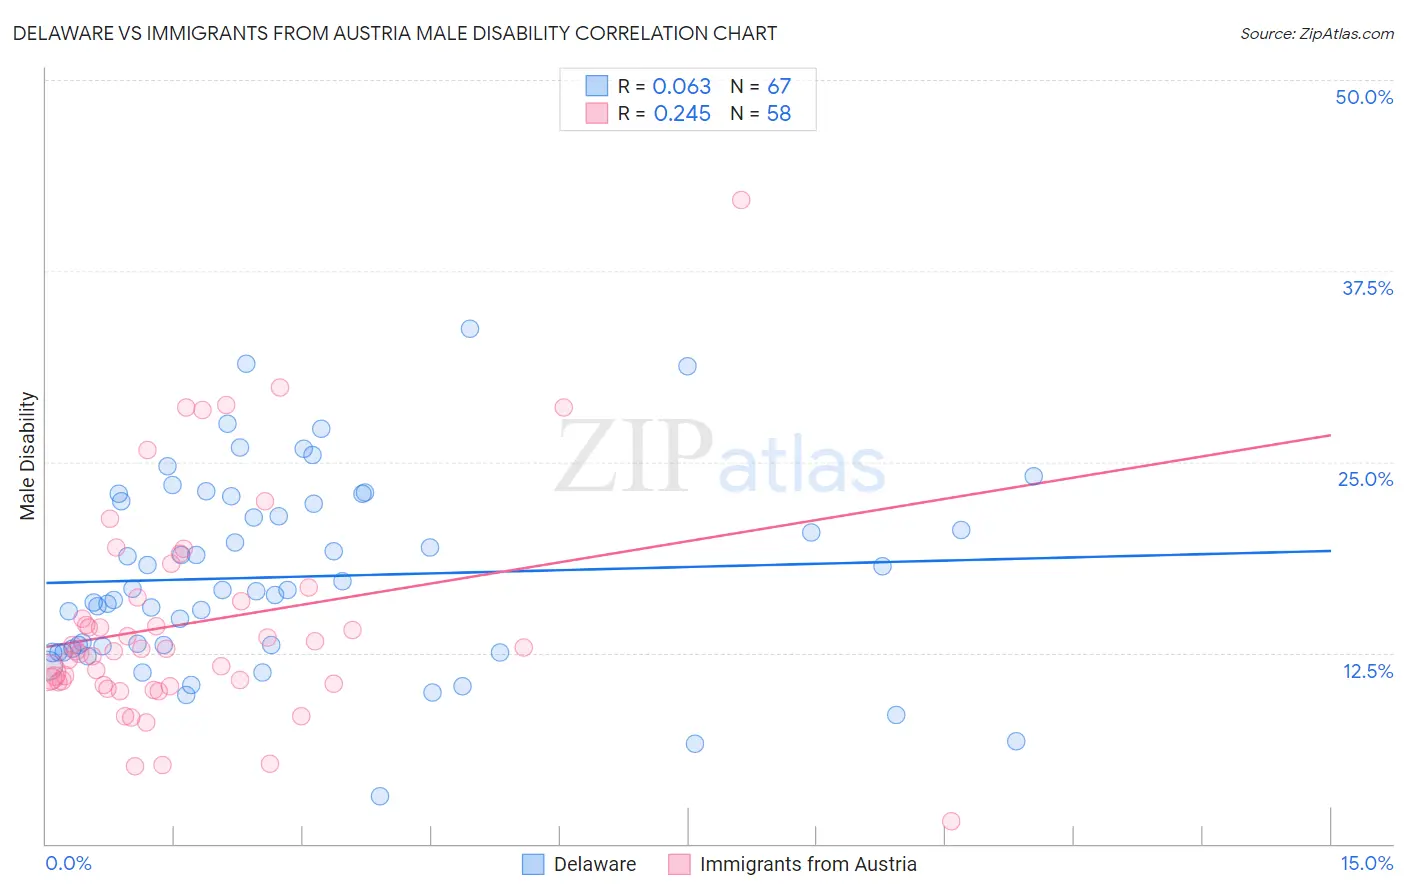
Delaware vs Immigrants from Austria Male Disability Correlation Chart
The statistical analysis conducted on geographies consisting of 96,239,516 people shows a slight positive correlation between the proportion of Delaware and percentage of males with a disability in the United States with a correlation coefficient (R) of 0.063 and weighted average of 13.5%. Similarly, the statistical analysis conducted on geographies consisting of 167,973,228 people shows a weak positive correlation between the proportion of Immigrants from Austria and percentage of males with a disability in the United States with a correlation coefficient (R) of 0.245 and weighted average of 11.4%, a difference of 18.4%.
Male Disability Correlation Summary
| Measurement | Delaware | Immigrants from Austria |
| Minimum | 3.1% | 1.4% |
| Maximum | 33.7% | 42.1% |
| Range | 30.6% | 40.7% |
| Mean | 17.5% | 14.5% |
| Median | 16.6% | 12.7% |
| Interquartile 25% (IQ1) | 12.7% | 10.5% |
| Interquartile 75% (IQ3) | 22.4% | 16.1% |
| Interquartile Range (IQR) | 9.7% | 5.7% |
| Standard Deviation (Sample) | 6.3% | 7.2% |
| Standard Deviation (Population) | 6.2% | 7.2% |
Similar Demographics by Male Disability
Demographics Similar to Delaware by Male Disability
In terms of male disability, the demographic groups most similar to Delaware are Immigrants from the Azores (13.4%, a difference of 0.19%), Blackfeet (13.4%, a difference of 0.33%), Yakama (13.5%, a difference of 0.55%), Puget Sound Salish (13.5%, a difference of 0.57%), and Aleut (13.5%, a difference of 0.63%).
| Demographics | Rating | Rank | Male Disability |
| Blacks/African Americans | 0.0 /100 | #304 | Tragic 13.2% |
| French Canadians | 0.0 /100 | #305 | Tragic 13.3% |
| Spanish Americans | 0.0 /100 | #306 | Tragic 13.3% |
| Arapaho | 0.0 /100 | #307 | Tragic 13.3% |
| French American Indians | 0.0 /100 | #308 | Tragic 13.4% |
| Blackfeet | 0.0 /100 | #309 | Tragic 13.4% |
| Immigrants | Azores | 0.0 /100 | #310 | Tragic 13.4% |
| Delaware | 0.0 /100 | #311 | Tragic 13.5% |
| Yakama | 0.0 /100 | #312 | Tragic 13.5% |
| Puget Sound Salish | 0.0 /100 | #313 | Tragic 13.5% |
| Aleuts | 0.0 /100 | #314 | Tragic 13.5% |
| Iroquois | 0.0 /100 | #315 | Tragic 13.6% |
| Alaska Natives | 0.0 /100 | #316 | Tragic 13.6% |
| Paiute | 0.0 /100 | #317 | Tragic 13.7% |
| Cree | 0.0 /100 | #318 | Tragic 13.7% |
Demographics Similar to Immigrants from Austria by Male Disability
In terms of male disability, the demographic groups most similar to Immigrants from Austria are Immigrants from Zaire (11.4%, a difference of 0.020%), Estonian (11.4%, a difference of 0.040%), Immigrants from Netherlands (11.4%, a difference of 0.10%), Immigrants from Bosnia and Herzegovina (11.4%, a difference of 0.14%), and Pakistani (11.3%, a difference of 0.20%).
| Demographics | Rating | Rank | Male Disability |
| Hondurans | 41.1 /100 | #180 | Average 11.3% |
| Immigrants | Senegal | 34.4 /100 | #181 | Fair 11.3% |
| Immigrants | Belize | 33.7 /100 | #182 | Fair 11.3% |
| Immigrants | Central America | 32.9 /100 | #183 | Fair 11.3% |
| Iraqis | 30.5 /100 | #184 | Fair 11.3% |
| Pakistanis | 30.3 /100 | #185 | Fair 11.3% |
| Immigrants | Zaire | 27.6 /100 | #186 | Fair 11.4% |
| Immigrants | Austria | 27.3 /100 | #187 | Fair 11.4% |
| Estonians | 26.8 /100 | #188 | Fair 11.4% |
| Immigrants | Netherlands | 25.9 /100 | #189 | Fair 11.4% |
| Immigrants | Bosnia and Herzegovina | 25.4 /100 | #190 | Fair 11.4% |
| Senegalese | 23.2 /100 | #191 | Fair 11.4% |
| Assyrians/Chaldeans/Syriacs | 23.2 /100 | #192 | Fair 11.4% |
| Greeks | 22.2 /100 | #193 | Fair 11.4% |
| Belizeans | 21.2 /100 | #194 | Fair 11.4% |