Delaware vs Cherokee Male Disability
COMPARE
Delaware
Cherokee
Male Disability
Male Disability Comparison
Delaware
Cherokee
13.5%
MALE DISABILITY
0.0/ 100
METRIC RATING
311th/ 347
METRIC RANK
14.8%
MALE DISABILITY
0.0/ 100
METRIC RATING
334th/ 347
METRIC RANK
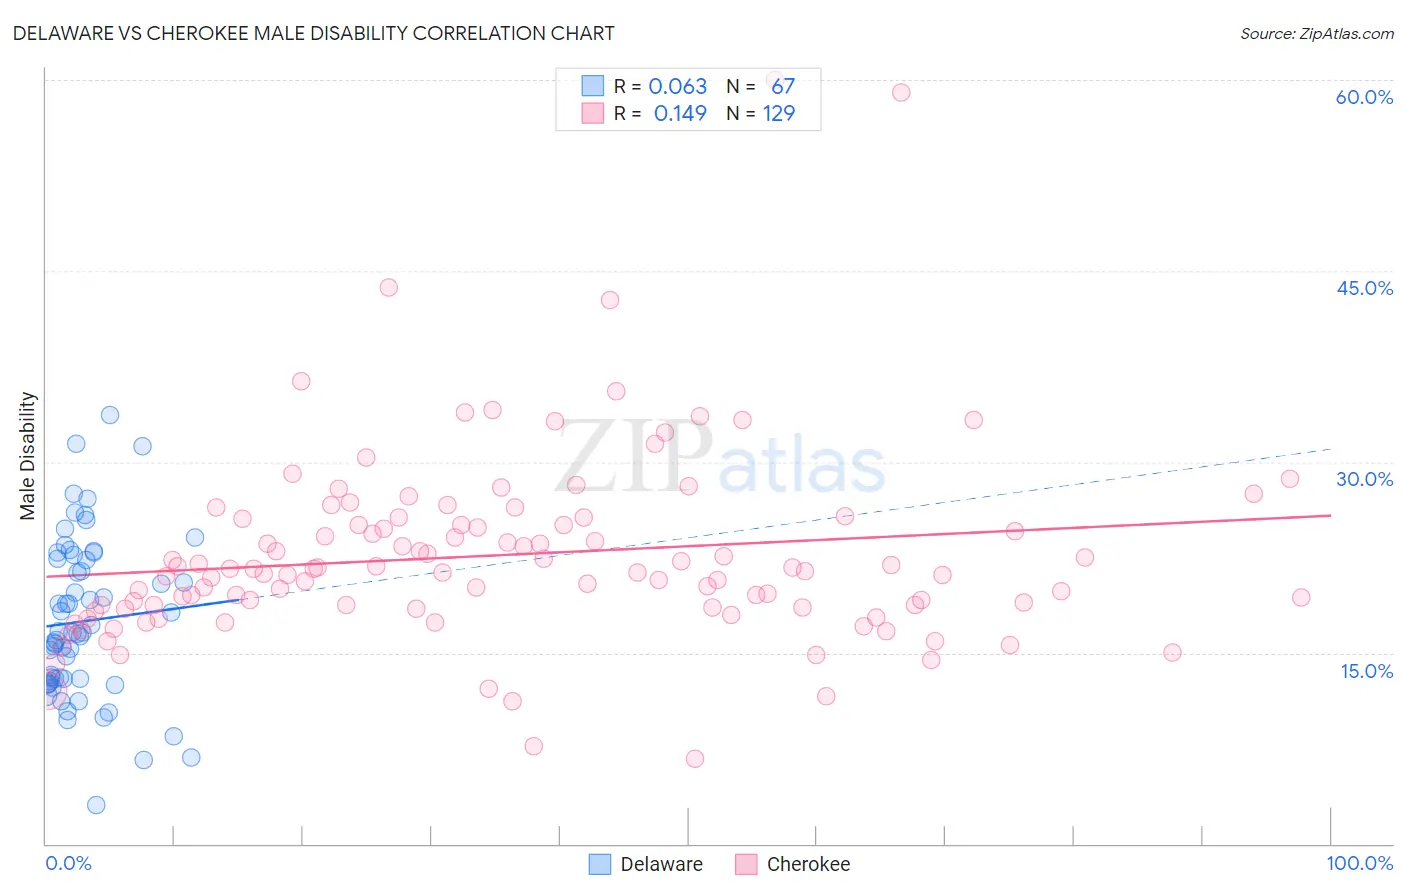
Delaware vs Cherokee Male Disability Correlation Chart
The statistical analysis conducted on geographies consisting of 96,239,516 people shows a slight positive correlation between the proportion of Delaware and percentage of males with a disability in the United States with a correlation coefficient (R) of 0.063 and weighted average of 13.5%. Similarly, the statistical analysis conducted on geographies consisting of 493,554,719 people shows a poor positive correlation between the proportion of Cherokee and percentage of males with a disability in the United States with a correlation coefficient (R) of 0.149 and weighted average of 14.8%, a difference of 10.2%.
Male Disability Correlation Summary
| Measurement | Delaware | Cherokee |
| Minimum | 3.1% | 6.7% |
| Maximum | 33.7% | 60.0% |
| Range | 30.6% | 53.3% |
| Mean | 17.5% | 22.7% |
| Median | 16.6% | 21.4% |
| Interquartile 25% (IQ1) | 12.7% | 18.5% |
| Interquartile 75% (IQ3) | 22.4% | 25.3% |
| Interquartile Range (IQR) | 9.7% | 6.7% |
| Standard Deviation (Sample) | 6.3% | 7.6% |
| Standard Deviation (Population) | 6.2% | 7.6% |
Similar Demographics by Male Disability
Demographics Similar to Delaware by Male Disability
In terms of male disability, the demographic groups most similar to Delaware are Immigrants from the Azores (13.4%, a difference of 0.19%), Blackfeet (13.4%, a difference of 0.33%), Yakama (13.5%, a difference of 0.55%), Puget Sound Salish (13.5%, a difference of 0.57%), and Aleut (13.5%, a difference of 0.63%).
| Demographics | Rating | Rank | Male Disability |
| Blacks/African Americans | 0.0 /100 | #304 | Tragic 13.2% |
| French Canadians | 0.0 /100 | #305 | Tragic 13.3% |
| Spanish Americans | 0.0 /100 | #306 | Tragic 13.3% |
| Arapaho | 0.0 /100 | #307 | Tragic 13.3% |
| French American Indians | 0.0 /100 | #308 | Tragic 13.4% |
| Blackfeet | 0.0 /100 | #309 | Tragic 13.4% |
| Immigrants | Azores | 0.0 /100 | #310 | Tragic 13.4% |
| Delaware | 0.0 /100 | #311 | Tragic 13.5% |
| Yakama | 0.0 /100 | #312 | Tragic 13.5% |
| Puget Sound Salish | 0.0 /100 | #313 | Tragic 13.5% |
| Aleuts | 0.0 /100 | #314 | Tragic 13.5% |
| Iroquois | 0.0 /100 | #315 | Tragic 13.6% |
| Alaska Natives | 0.0 /100 | #316 | Tragic 13.6% |
| Paiute | 0.0 /100 | #317 | Tragic 13.7% |
| Cree | 0.0 /100 | #318 | Tragic 13.7% |
Demographics Similar to Cherokee by Male Disability
In terms of male disability, the demographic groups most similar to Cherokee are Dutch West Indian (14.8%, a difference of 0.020%), Alaskan Athabascan (14.9%, a difference of 0.49%), Yuman (14.7%, a difference of 0.68%), Seminole (14.7%, a difference of 0.78%), and Menominee (15.0%, a difference of 1.0%).
| Demographics | Rating | Rank | Male Disability |
| Potawatomi | 0.0 /100 | #327 | Tragic 14.2% |
| Chippewa | 0.0 /100 | #328 | Tragic 14.3% |
| Cajuns | 0.0 /100 | #329 | Tragic 14.4% |
| Navajo | 0.0 /100 | #330 | Tragic 14.4% |
| Tohono O'odham | 0.0 /100 | #331 | Tragic 14.6% |
| Seminole | 0.0 /100 | #332 | Tragic 14.7% |
| Yuman | 0.0 /100 | #333 | Tragic 14.7% |
| Cherokee | 0.0 /100 | #334 | Tragic 14.8% |
| Dutch West Indians | 0.0 /100 | #335 | Tragic 14.8% |
| Alaskan Athabascans | 0.0 /100 | #336 | Tragic 14.9% |
| Menominee | 0.0 /100 | #337 | Tragic 15.0% |
| Pueblo | 0.0 /100 | #338 | Tragic 15.0% |
| Chickasaw | 0.0 /100 | #339 | Tragic 15.1% |
| Lumbee | 0.0 /100 | #340 | Tragic 15.2% |
| Choctaw | 0.0 /100 | #341 | Tragic 15.4% |