Delaware vs Romanian Male Unemployment
COMPARE
Delaware
Romanian
Male Unemployment
Male Unemployment Comparison
Delaware
Romanians
5.5%
MALE UNEMPLOYMENT
4.2/ 100
METRIC RATING
217th/ 347
METRIC RANK
5.1%
MALE UNEMPLOYMENT
89.8/ 100
METRIC RATING
114th/ 347
METRIC RANK
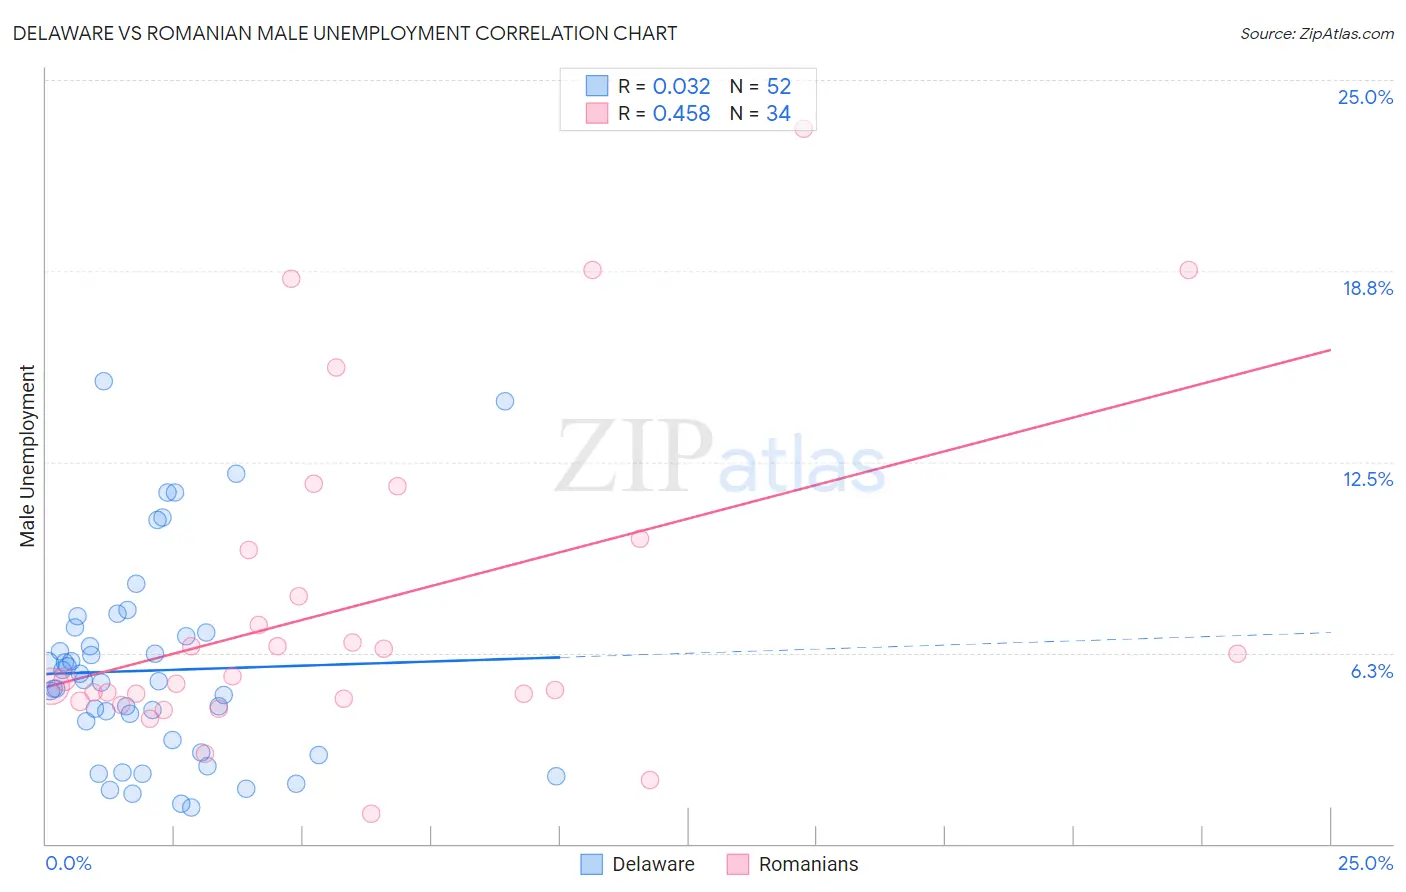
Delaware vs Romanian Male Unemployment Correlation Chart
The statistical analysis conducted on geographies consisting of 96,069,149 people shows no correlation between the proportion of Delaware and unemployment rate among males in the United States with a correlation coefficient (R) of 0.032 and weighted average of 5.5%. Similarly, the statistical analysis conducted on geographies consisting of 376,462,123 people shows a moderate positive correlation between the proportion of Romanians and unemployment rate among males in the United States with a correlation coefficient (R) of 0.458 and weighted average of 5.1%, a difference of 8.0%.
Male Unemployment Correlation Summary
| Measurement | Delaware | Romanian |
| Minimum | 1.2% | 1.0% |
| Maximum | 15.1% | 23.4% |
| Range | 13.9% | 22.4% |
| Mean | 5.7% | 7.8% |
| Median | 5.3% | 5.4% |
| Interquartile 25% (IQ1) | 3.2% | 4.7% |
| Interquartile 75% (IQ3) | 6.8% | 9.6% |
| Interquartile Range (IQR) | 3.6% | 4.9% |
| Standard Deviation (Sample) | 3.3% | 5.3% |
| Standard Deviation (Population) | 3.2% | 5.3% |
Similar Demographics by Male Unemployment
Demographics Similar to Delaware by Male Unemployment
In terms of male unemployment, the demographic groups most similar to Delaware are Immigrants (5.5%, a difference of 0.050%), Immigrants from Albania (5.5%, a difference of 0.21%), Samoan (5.5%, a difference of 0.22%), Immigrants from Western Asia (5.6%, a difference of 0.25%), and Portuguese (5.6%, a difference of 0.28%).
| Demographics | Rating | Rank | Male Unemployment |
| South American Indians | 7.6 /100 | #210 | Tragic 5.5% |
| Israelis | 7.4 /100 | #211 | Tragic 5.5% |
| Hmong | 7.0 /100 | #212 | Tragic 5.5% |
| Ugandans | 6.3 /100 | #213 | Tragic 5.5% |
| Puget Sound Salish | 5.6 /100 | #214 | Tragic 5.5% |
| Samoans | 4.9 /100 | #215 | Tragic 5.5% |
| Immigrants | Immigrants | 4.3 /100 | #216 | Tragic 5.5% |
| Delaware | 4.2 /100 | #217 | Tragic 5.5% |
| Immigrants | Albania | 3.6 /100 | #218 | Tragic 5.5% |
| Immigrants | Western Asia | 3.5 /100 | #219 | Tragic 5.6% |
| Portuguese | 3.5 /100 | #220 | Tragic 5.6% |
| Soviet Union | 3.2 /100 | #221 | Tragic 5.6% |
| Immigrants | Micronesia | 2.9 /100 | #222 | Tragic 5.6% |
| Creek | 2.6 /100 | #223 | Tragic 5.6% |
| Cherokee | 2.4 /100 | #224 | Tragic 5.6% |
Demographics Similar to Romanians by Male Unemployment
In terms of male unemployment, the demographic groups most similar to Romanians are Immigrants from Asia (5.1%, a difference of 0.030%), Immigrants from Denmark (5.1%, a difference of 0.070%), Immigrants from Moldova (5.1%, a difference of 0.080%), Immigrants from Austria (5.1%, a difference of 0.080%), and Estonian (5.1%, a difference of 0.12%).
| Demographics | Rating | Rank | Male Unemployment |
| Ethiopians | 91.3 /100 | #107 | Exceptional 5.1% |
| Immigrants | Nicaragua | 91.2 /100 | #108 | Exceptional 5.1% |
| Immigrants | Pakistan | 90.9 /100 | #109 | Exceptional 5.1% |
| Immigrants | England | 90.8 /100 | #110 | Exceptional 5.1% |
| Immigrants | Eastern Asia | 90.8 /100 | #111 | Exceptional 5.1% |
| Immigrants | Moldova | 90.3 /100 | #112 | Exceptional 5.1% |
| Immigrants | Austria | 90.3 /100 | #113 | Exceptional 5.1% |
| Romanians | 89.8 /100 | #114 | Excellent 5.1% |
| Immigrants | Asia | 89.6 /100 | #115 | Excellent 5.1% |
| Immigrants | Denmark | 89.4 /100 | #116 | Excellent 5.1% |
| Estonians | 89.0 /100 | #117 | Excellent 5.1% |
| Cypriots | 88.8 /100 | #118 | Excellent 5.1% |
| French Canadians | 88.6 /100 | #119 | Excellent 5.1% |
| Ukrainians | 88.4 /100 | #120 | Excellent 5.1% |
| Mongolians | 88.4 /100 | #121 | Excellent 5.1% |