Delaware vs Cherokee In Labor Force | Age 30-34
COMPARE
Delaware
Cherokee
In Labor Force | Age 30-34
In Labor Force | Age 30-34 Comparison
Delaware
Cherokee
83.5%
IN LABOR FORCE | AGE 30-34
0.0/ 100
METRIC RATING
277th/ 347
METRIC RANK
81.6%
IN LABOR FORCE | AGE 30-34
0.0/ 100
METRIC RATING
315th/ 347
METRIC RANK
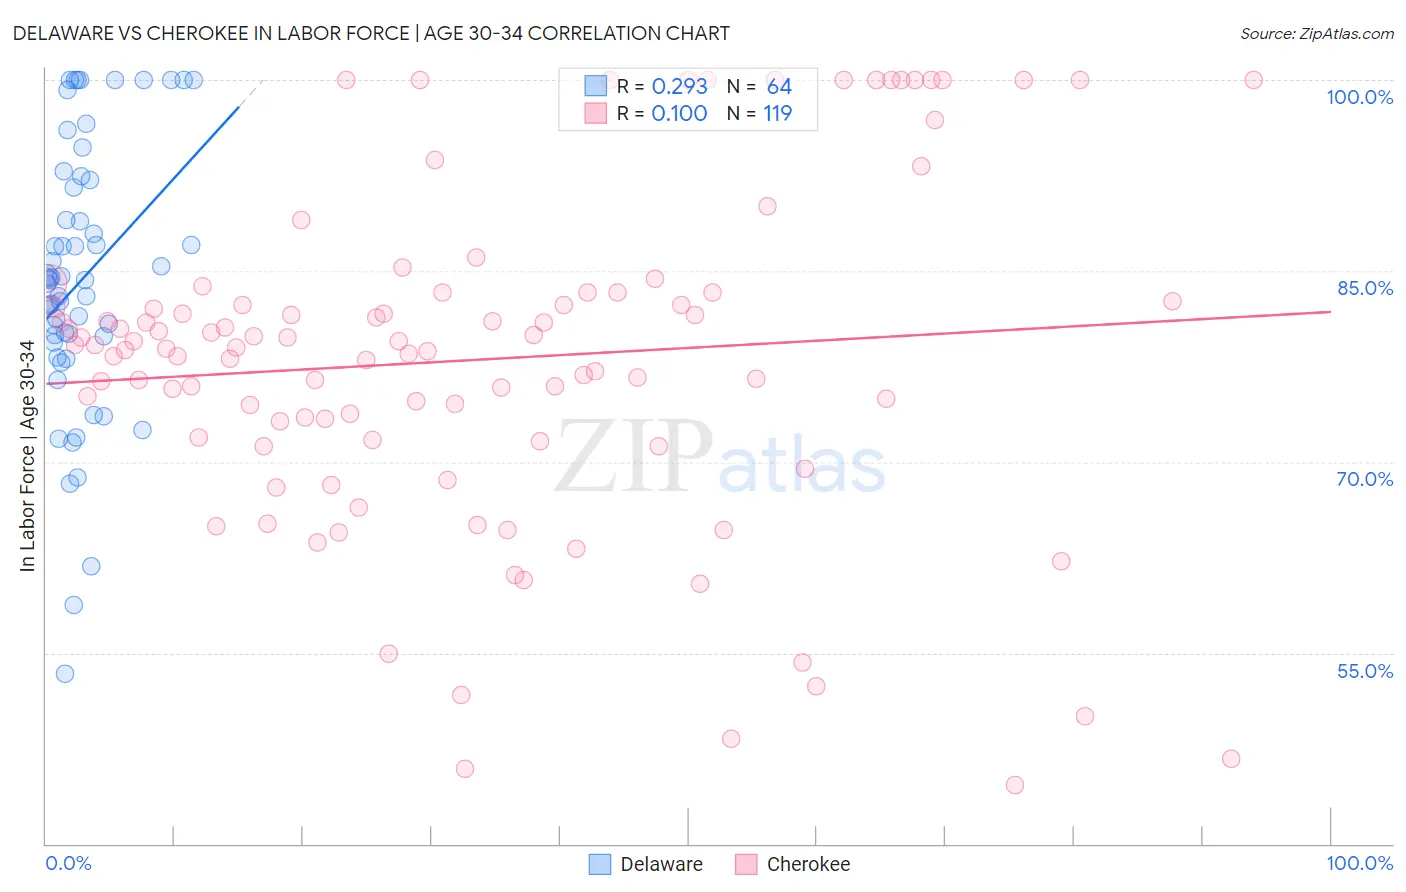
Delaware vs Cherokee In Labor Force | Age 30-34 Correlation Chart
The statistical analysis conducted on geographies consisting of 96,207,196 people shows a weak positive correlation between the proportion of Delaware and labor force participation rate among population between the ages 30 and 34 in the United States with a correlation coefficient (R) of 0.293 and weighted average of 83.5%. Similarly, the statistical analysis conducted on geographies consisting of 493,185,438 people shows a poor positive correlation between the proportion of Cherokee and labor force participation rate among population between the ages 30 and 34 in the United States with a correlation coefficient (R) of 0.100 and weighted average of 81.6%, a difference of 2.3%.
In Labor Force | Age 30-34 Correlation Summary
| Measurement | Delaware | Cherokee |
| Minimum | 53.3% | 44.6% |
| Maximum | 100.0% | 100.0% |
| Range | 46.7% | 55.4% |
| Mean | 84.3% | 78.0% |
| Median | 84.3% | 79.0% |
| Interquartile 25% (IQ1) | 79.6% | 71.7% |
| Interquartile 75% (IQ3) | 91.8% | 83.3% |
| Interquartile Range (IQR) | 12.3% | 11.6% |
| Standard Deviation (Sample) | 10.5% | 13.1% |
| Standard Deviation (Population) | 10.4% | 13.0% |
Similar Demographics by In Labor Force | Age 30-34
Demographics Similar to Delaware by In Labor Force | Age 30-34
In terms of in labor force | age 30-34, the demographic groups most similar to Delaware are Tongan (83.5%, a difference of 0.020%), Belizean (83.5%, a difference of 0.030%), Immigrants from Grenada (83.5%, a difference of 0.030%), Guamanian/Chamorro (83.5%, a difference of 0.040%), and Fijian (83.4%, a difference of 0.050%).
| Demographics | Rating | Rank | In Labor Force | Age 30-34 |
| Spanish Americans | 0.0 /100 | #270 | Tragic 83.5% |
| Spanish | 0.0 /100 | #271 | Tragic 83.5% |
| Immigrants | Nonimmigrants | 0.0 /100 | #272 | Tragic 83.5% |
| Guamanians/Chamorros | 0.0 /100 | #273 | Tragic 83.5% |
| Belizeans | 0.0 /100 | #274 | Tragic 83.5% |
| Immigrants | Grenada | 0.0 /100 | #275 | Tragic 83.5% |
| Tongans | 0.0 /100 | #276 | Tragic 83.5% |
| Delaware | 0.0 /100 | #277 | Tragic 83.5% |
| Fijians | 0.0 /100 | #278 | Tragic 83.4% |
| Immigrants | Fiji | 0.0 /100 | #279 | Tragic 83.4% |
| Africans | 0.0 /100 | #280 | Tragic 83.4% |
| Samoans | 0.0 /100 | #281 | Tragic 83.3% |
| Mexican American Indians | 0.0 /100 | #282 | Tragic 83.2% |
| Assyrians/Chaldeans/Syriacs | 0.0 /100 | #283 | Tragic 83.2% |
| Immigrants | Belize | 0.0 /100 | #284 | Tragic 83.2% |
Demographics Similar to Cherokee by In Labor Force | Age 30-34
In terms of in labor force | age 30-34, the demographic groups most similar to Cherokee are Alaskan Athabascan (81.7%, a difference of 0.10%), Immigrants from the Azores (81.5%, a difference of 0.15%), Arapaho (81.5%, a difference of 0.16%), Choctaw (81.4%, a difference of 0.23%), and Shoshone (81.4%, a difference of 0.24%).
| Demographics | Rating | Rank | In Labor Force | Age 30-34 |
| Puget Sound Salish | 0.0 /100 | #308 | Tragic 82.1% |
| Immigrants | Mexico | 0.0 /100 | #309 | Tragic 82.0% |
| Cajuns | 0.0 /100 | #310 | Tragic 82.0% |
| Chickasaw | 0.0 /100 | #311 | Tragic 81.9% |
| Mexicans | 0.0 /100 | #312 | Tragic 81.9% |
| Iroquois | 0.0 /100 | #313 | Tragic 81.9% |
| Alaskan Athabascans | 0.0 /100 | #314 | Tragic 81.7% |
| Cherokee | 0.0 /100 | #315 | Tragic 81.6% |
| Immigrants | Azores | 0.0 /100 | #316 | Tragic 81.5% |
| Arapaho | 0.0 /100 | #317 | Tragic 81.5% |
| Choctaw | 0.0 /100 | #318 | Tragic 81.4% |
| Shoshone | 0.0 /100 | #319 | Tragic 81.4% |
| Yaqui | 0.0 /100 | #320 | Tragic 81.4% |
| Alaska Natives | 0.0 /100 | #321 | Tragic 81.3% |
| Puerto Ricans | 0.0 /100 | #322 | Tragic 81.2% |