Danish vs Immigrants from Canada Associate's Degree
COMPARE
Danish
Immigrants from Canada
Associate's Degree
Associate's Degree Comparison
Danes
Immigrants from Canada
47.4%
ASSOCIATE'S DEGREE
77.3/ 100
METRIC RATING
147th/ 347
METRIC RANK
50.1%
ASSOCIATE'S DEGREE
98.7/ 100
METRIC RATING
88th/ 347
METRIC RANK
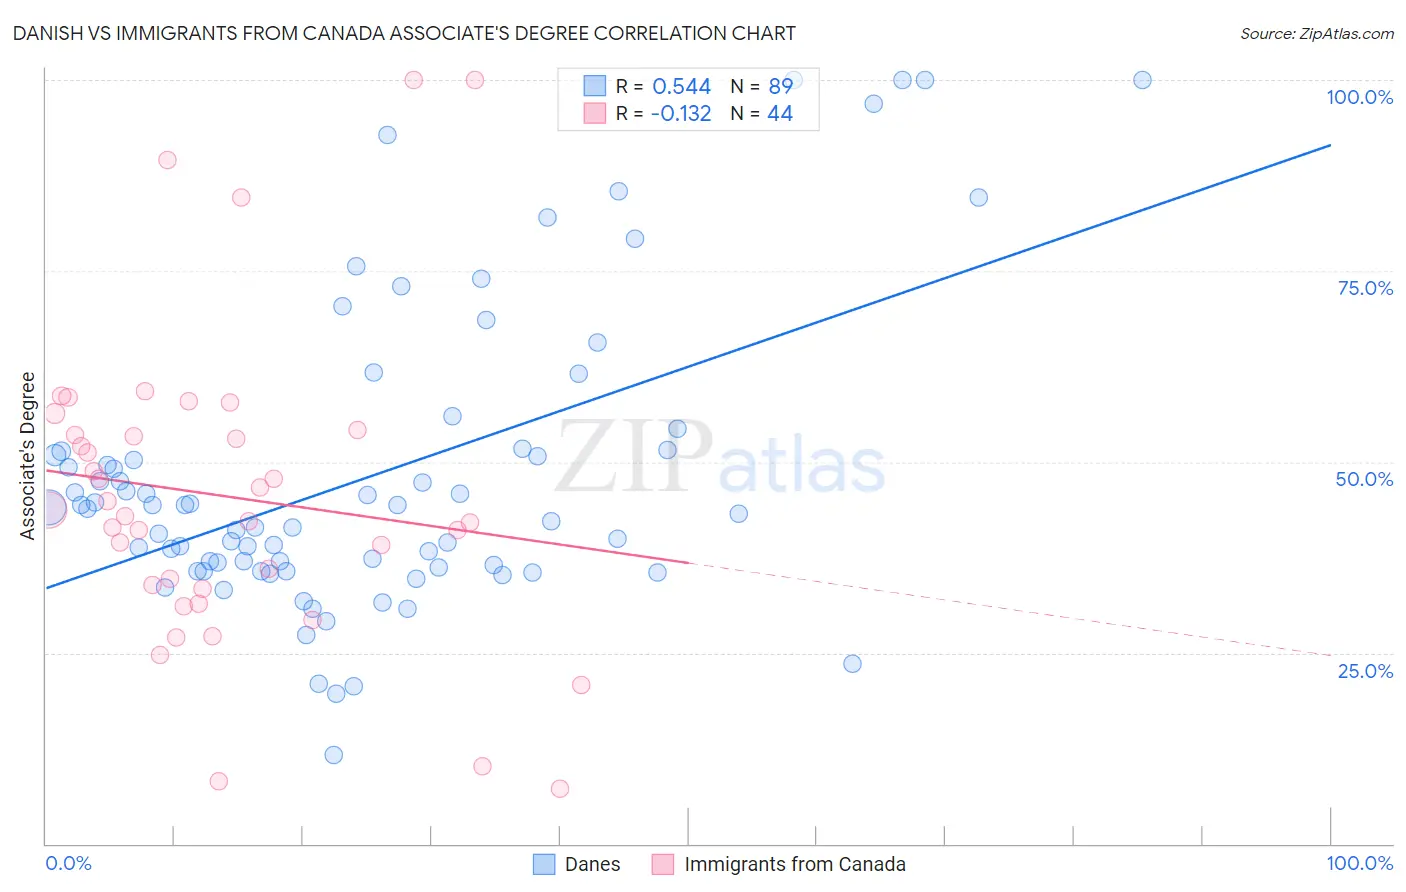
Danish vs Immigrants from Canada Associate's Degree Correlation Chart
The statistical analysis conducted on geographies consisting of 474,170,437 people shows a substantial positive correlation between the proportion of Danes and percentage of population with at least associate's degree education in the United States with a correlation coefficient (R) of 0.544 and weighted average of 47.4%. Similarly, the statistical analysis conducted on geographies consisting of 459,369,326 people shows a poor negative correlation between the proportion of Immigrants from Canada and percentage of population with at least associate's degree education in the United States with a correlation coefficient (R) of -0.132 and weighted average of 50.1%, a difference of 5.7%.
Associate's Degree Correlation Summary
| Measurement | Danish | Immigrants from Canada |
| Minimum | 11.7% | 7.1% |
| Maximum | 100.0% | 100.0% |
| Range | 88.3% | 92.9% |
| Mean | 48.1% | 45.5% |
| Median | 43.9% | 43.3% |
| Interquartile 25% (IQ1) | 36.0% | 33.6% |
| Interquartile 75% (IQ3) | 51.5% | 53.9% |
| Interquartile Range (IQR) | 15.5% | 20.3% |
| Standard Deviation (Sample) | 19.6% | 20.4% |
| Standard Deviation (Population) | 19.5% | 20.2% |
Similar Demographics by Associate's Degree
Demographics Similar to Danes by Associate's Degree
In terms of associate's degree, the demographic groups most similar to Danes are Immigrants from Sudan (47.4%, a difference of 0.050%), South American Indian (47.4%, a difference of 0.060%), Immigrants from Armenia (47.4%, a difference of 0.070%), Iraqi (47.4%, a difference of 0.11%), and Immigrants from North Macedonia (47.4%, a difference of 0.14%).
| Demographics | Rating | Rank | Associate's Degree |
| Immigrants | Southern Europe | 84.4 /100 | #140 | Excellent 47.8% |
| Taiwanese | 83.3 /100 | #141 | Excellent 47.7% |
| Sierra Leoneans | 82.9 /100 | #142 | Excellent 47.7% |
| Norwegians | 81.0 /100 | #143 | Excellent 47.6% |
| Slavs | 80.5 /100 | #144 | Excellent 47.6% |
| Canadians | 79.0 /100 | #145 | Good 47.5% |
| Immigrants | Sudan | 77.9 /100 | #146 | Good 47.4% |
| Danes | 77.3 /100 | #147 | Good 47.4% |
| South American Indians | 76.7 /100 | #148 | Good 47.4% |
| Immigrants | Armenia | 76.6 /100 | #149 | Good 47.4% |
| Iraqis | 76.2 /100 | #150 | Good 47.4% |
| Immigrants | North Macedonia | 76.0 /100 | #151 | Good 47.4% |
| Immigrants | Afghanistan | 74.3 /100 | #152 | Good 47.3% |
| Czechs | 72.2 /100 | #153 | Good 47.2% |
| Immigrants | Kenya | 72.1 /100 | #154 | Good 47.2% |
Demographics Similar to Immigrants from Canada by Associate's Degree
In terms of associate's degree, the demographic groups most similar to Immigrants from Canada are Immigrants from Western Europe (50.1%, a difference of 0.010%), Immigrants from Ethiopia (50.1%, a difference of 0.010%), Immigrants from Moldova (50.2%, a difference of 0.070%), Immigrants from Western Asia (50.1%, a difference of 0.090%), and Immigrants from North America (50.1%, a difference of 0.11%).
| Demographics | Rating | Rank | Associate's Degree |
| Maltese | 99.1 /100 | #81 | Exceptional 50.4% |
| Greeks | 98.9 /100 | #82 | Exceptional 50.3% |
| Immigrants | Uzbekistan | 98.9 /100 | #83 | Exceptional 50.3% |
| Immigrants | Hungary | 98.9 /100 | #84 | Exceptional 50.2% |
| Immigrants | Egypt | 98.9 /100 | #85 | Exceptional 50.2% |
| Immigrants | Croatia | 98.9 /100 | #86 | Exceptional 50.2% |
| Immigrants | Moldova | 98.8 /100 | #87 | Exceptional 50.2% |
| Immigrants | Canada | 98.7 /100 | #88 | Exceptional 50.1% |
| Immigrants | Western Europe | 98.7 /100 | #89 | Exceptional 50.1% |
| Immigrants | Ethiopia | 98.7 /100 | #90 | Exceptional 50.1% |
| Immigrants | Western Asia | 98.7 /100 | #91 | Exceptional 50.1% |
| Immigrants | North America | 98.7 /100 | #92 | Exceptional 50.1% |
| Immigrants | Brazil | 98.5 /100 | #93 | Exceptional 50.0% |
| Laotians | 98.4 /100 | #94 | Exceptional 49.9% |
| Immigrants | England | 98.0 /100 | #95 | Exceptional 49.7% |