Danish vs Spaniard Disability Age 5 to 17
COMPARE
Danish
Spaniard
Disability Age 5 to 17
Disability Age 5 to 17 Comparison
Danes
Spaniards
5.7%
DISABILITY AGE 5 TO 17
26.5/ 100
METRIC RATING
191st/ 347
METRIC RANK
5.9%
DISABILITY AGE 5 TO 17
2.0/ 100
METRIC RATING
242nd/ 347
METRIC RANK
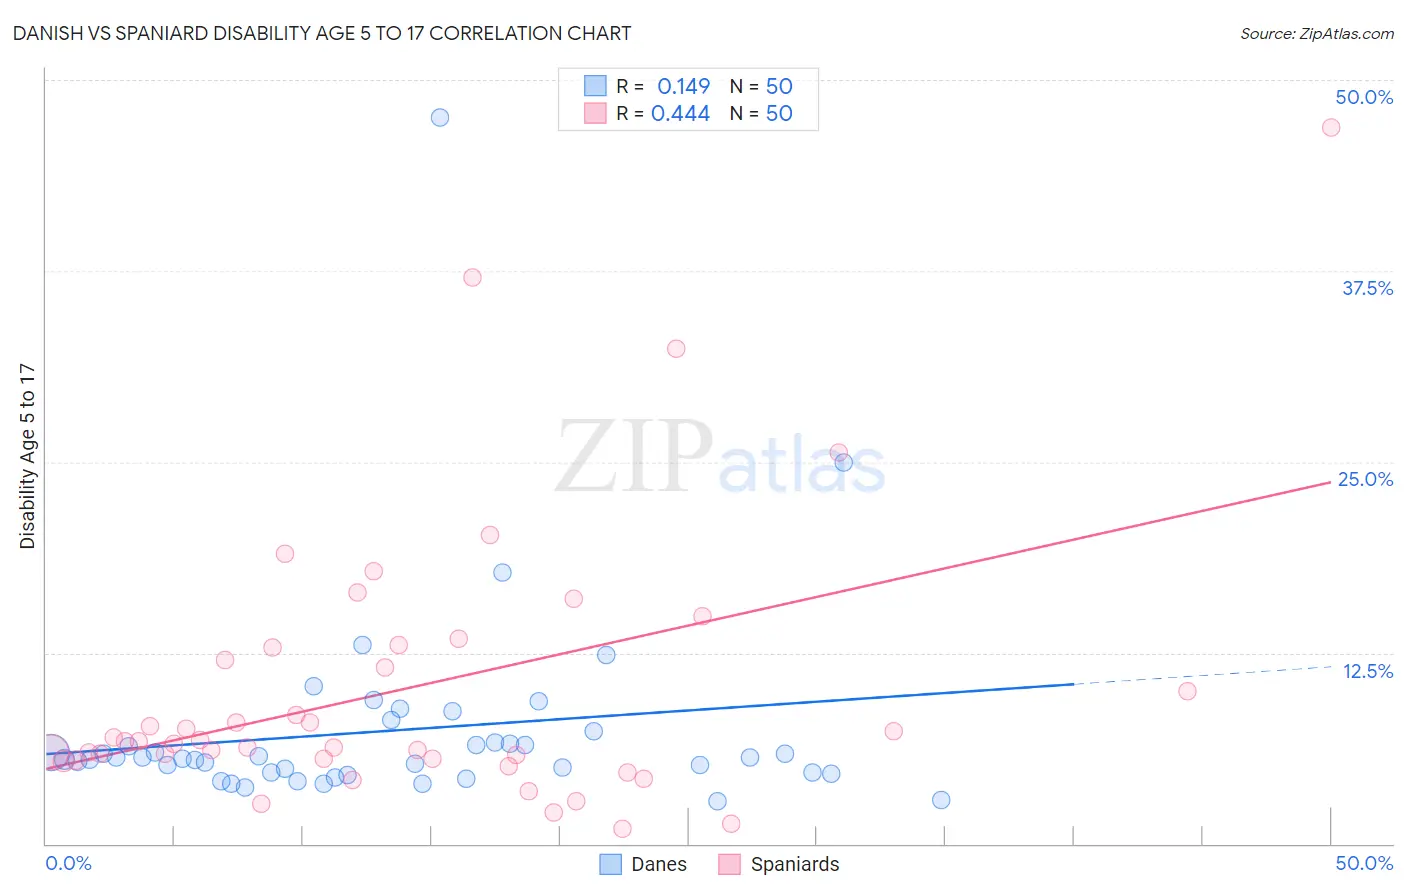
Danish vs Spaniard Disability Age 5 to 17 Correlation Chart
The statistical analysis conducted on geographies consisting of 467,230,380 people shows a poor positive correlation between the proportion of Danes and percentage of population with a disability between the ages 5 and 17 in the United States with a correlation coefficient (R) of 0.149 and weighted average of 5.7%. Similarly, the statistical analysis conducted on geographies consisting of 438,849,773 people shows a moderate positive correlation between the proportion of Spaniards and percentage of population with a disability between the ages 5 and 17 in the United States with a correlation coefficient (R) of 0.444 and weighted average of 5.9%, a difference of 3.5%.
Disability Age 5 to 17 Correlation Summary
| Measurement | Danish | Spaniard |
| Minimum | 2.8% | 0.99% |
| Maximum | 47.6% | 46.9% |
| Range | 44.8% | 45.9% |
| Mean | 7.4% | 10.2% |
| Median | 5.6% | 6.7% |
| Interquartile 25% (IQ1) | 4.7% | 5.6% |
| Interquartile 75% (IQ3) | 6.6% | 12.9% |
| Interquartile Range (IQR) | 1.9% | 7.3% |
| Standard Deviation (Sample) | 6.9% | 9.0% |
| Standard Deviation (Population) | 6.9% | 9.0% |
Similar Demographics by Disability Age 5 to 17
Demographics Similar to Danes by Disability Age 5 to 17
In terms of disability age 5 to 17, the demographic groups most similar to Danes are Immigrants from Bosnia and Herzegovina (5.7%, a difference of 0.010%), Immigrants from Canada (5.7%, a difference of 0.030%), Immigrants from Eastern Africa (5.7%, a difference of 0.050%), Pueblo (5.7%, a difference of 0.060%), and Marshallese (5.7%, a difference of 0.10%).
| Demographics | Rating | Rank | Disability Age 5 to 17 |
| Syrians | 33.8 /100 | #184 | Fair 5.6% |
| Immigrants | Mexico | 33.7 /100 | #185 | Fair 5.6% |
| Fijians | 31.7 /100 | #186 | Fair 5.7% |
| Immigrants | Thailand | 30.2 /100 | #187 | Fair 5.7% |
| Marshallese | 28.1 /100 | #188 | Fair 5.7% |
| Pueblo | 27.5 /100 | #189 | Fair 5.7% |
| Immigrants | Eastern Africa | 27.3 /100 | #190 | Fair 5.7% |
| Danes | 26.5 /100 | #191 | Fair 5.7% |
| Immigrants | Bosnia and Herzegovina | 26.3 /100 | #192 | Fair 5.7% |
| Immigrants | Canada | 26.1 /100 | #193 | Fair 5.7% |
| Croatians | 23.6 /100 | #194 | Fair 5.7% |
| Immigrants | Nigeria | 23.4 /100 | #195 | Fair 5.7% |
| Inupiat | 23.3 /100 | #196 | Fair 5.7% |
| Immigrants | North America | 23.1 /100 | #197 | Fair 5.7% |
| Norwegians | 20.9 /100 | #198 | Fair 5.7% |
Demographics Similar to Spaniards by Disability Age 5 to 17
In terms of disability age 5 to 17, the demographic groups most similar to Spaniards are Indonesian (5.9%, a difference of 0.010%), Immigrants from Germany (5.9%, a difference of 0.070%), Immigrants from Micronesia (5.9%, a difference of 0.070%), Immigrants from Caribbean (5.9%, a difference of 0.080%), and Tlingit-Haida (5.9%, a difference of 0.080%).
| Demographics | Rating | Rank | Disability Age 5 to 17 |
| Malaysians | 3.4 /100 | #235 | Tragic 5.8% |
| Immigrants | Brazil | 3.2 /100 | #236 | Tragic 5.8% |
| Sudanese | 2.9 /100 | #237 | Tragic 5.8% |
| Hungarians | 2.6 /100 | #238 | Tragic 5.8% |
| German Russians | 2.4 /100 | #239 | Tragic 5.9% |
| West Indians | 2.4 /100 | #240 | Tragic 5.9% |
| Immigrants | Caribbean | 2.1 /100 | #241 | Tragic 5.9% |
| Spaniards | 2.0 /100 | #242 | Tragic 5.9% |
| Indonesians | 2.0 /100 | #243 | Tragic 5.9% |
| Immigrants | Germany | 1.9 /100 | #244 | Tragic 5.9% |
| Immigrants | Micronesia | 1.9 /100 | #245 | Tragic 5.9% |
| Tlingit-Haida | 1.9 /100 | #246 | Tragic 5.9% |
| Immigrants | Honduras | 1.8 /100 | #247 | Tragic 5.9% |
| British | 1.7 /100 | #248 | Tragic 5.9% |
| Immigrants | Ghana | 1.7 /100 | #249 | Tragic 5.9% |